Figures & data
Figure 1. Quarterly and annual real DGP growth for China, starting in 1961 and ending in 2009Q4
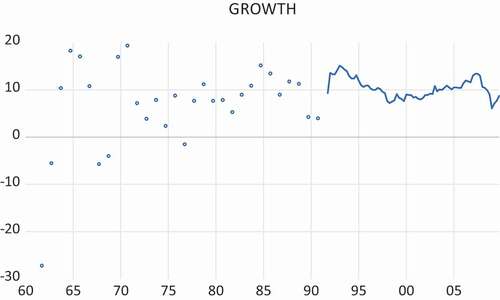
Figure 2. Real Gross Domestic Product 1995Q1-2019Q4 for the Netherlands (in billions of Euros)
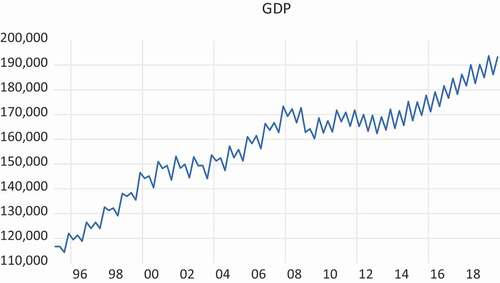
Figure 3. Real Gross Domestic Product 1995Q1-2019Q4 for the Netherlands (in billions of Euros), when cumulated as Q1, Q1+ Q2, Q1+ Q2+ Q3 and Q1+ Q2+ Q3+ Q4
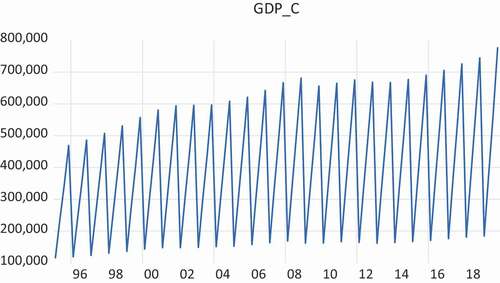
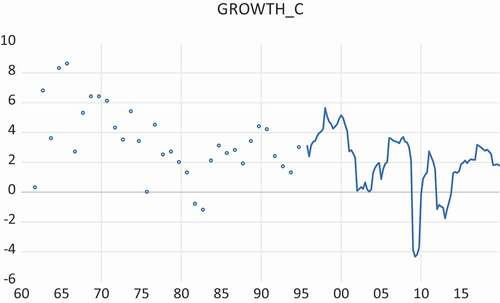
Figure 4. Annual growth rates of Real GDP, 1996Q1-2019Q4, for the Netherlands, based on quarterly GDP figures (GROWTH) and based on cumulative quarterly GDP figures (GROWTH_C), computed as
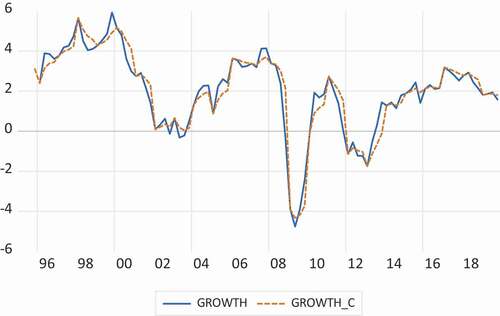
Figure 5. Annual growth rates of real GDP for 1961Q4-2019Q4 for the Netherlands