
Figures & data
Table 1. Parametric component estimates of semi-parametic model of terrorism on other explanatory variables
Figure 1. Non-parametric component of the effect of top 1% income shares on total and domestic terrorism incidents for all countries.
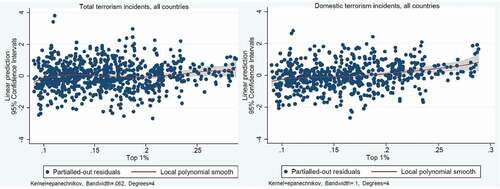
Figure 2. Non-parametric component of the effect of top 1% income shares on total and domestic terrorism fatalities (killed) for all countries.
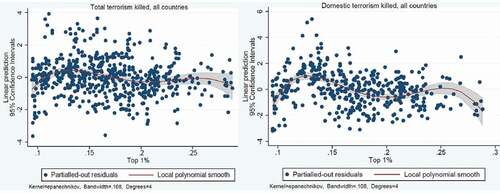
Figure 3. Non-parametric component of the effect of top 10% and top 1% income shares on total and domestic terrorism incidents for developing countries.
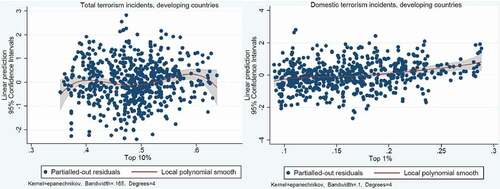
Figure 4. Non-parametric component of the effect of the Gini on total terrorism incidents for all countries and developing countries.
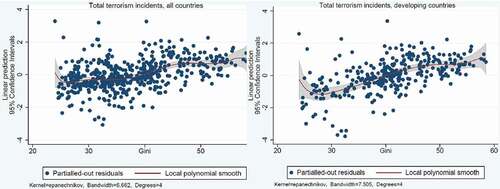
Table A1. Countries in the dataset
Data availability statement
The data and code that support the findings of this study are available from the authors upon request.