
Figures & data
Figure 1. Iceberg decomposition for 2020.
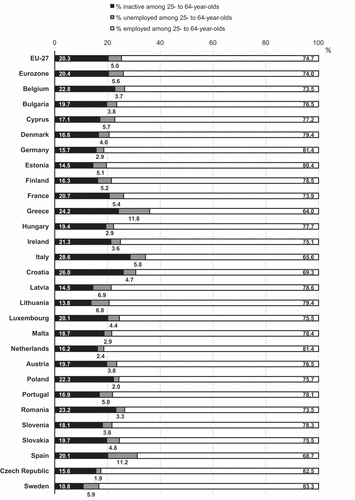
Table 1. Evolution of the unemployment-to-population ratio (among 25- to 64-year-olds).
Table 2. Evolution of the inactivity-to-population ratio (among 25- to 64-year-olds).
Figure 2. Evolution of the unemployment-to-population and inactivity-to-population ratios (among 25- to 64-year-olds) in the 12 largest EU countries.
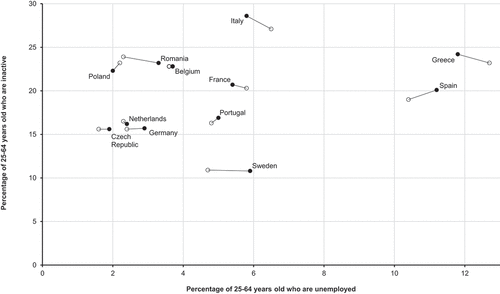
Figure 3. Changes in the percentage of 25- to 64-year-old inactive persons with as a main reason the belief that jobs are not available for the 12 largest EU countries.
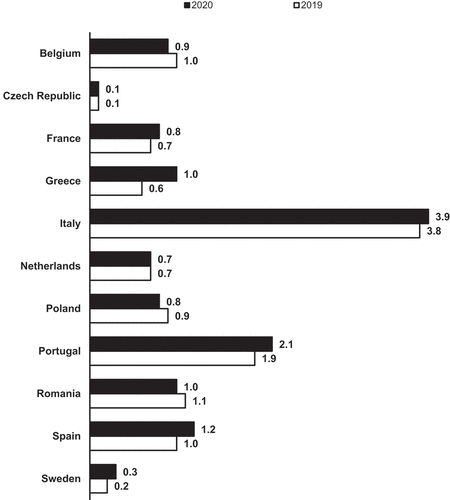
Table A1. Source data
Table A2. Evolution of the unemployment-to-population ratio (among 25- to 64- year-olds) during the Great Recession
Table A3. Evolution of the inactivity-to-population ratio (among 25- to 64-year- olds) during the Great Recession