Figures & data
Table 1. Summary statistics of the three stock returns (1 January 1990 – 31 December 2017)
Table 2. Posterior estimates for the in-sample data (1 January 1990 – 31 December 2017)
Figure 1. The filtered volatility and the filtered dynamic leverage effect
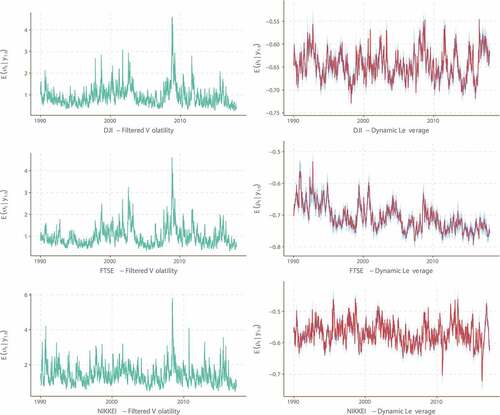
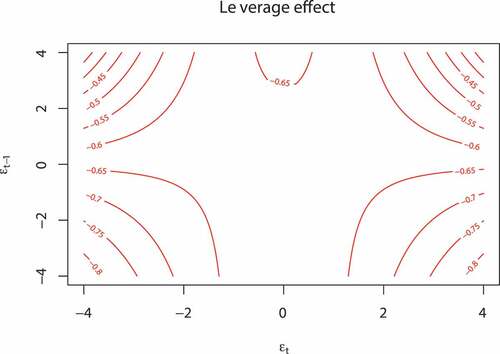
Figure 2. The contour plot shows the impact of the temporal return innovations () on the dynamic leverage correlation
for the DJI data. The current GAS process
is assumed to stay at its long-term mean
and