
Figures & data
Figure 1. Framework of the model.
Note: the formulations of mathematical terms for GNN are given in the appendix.
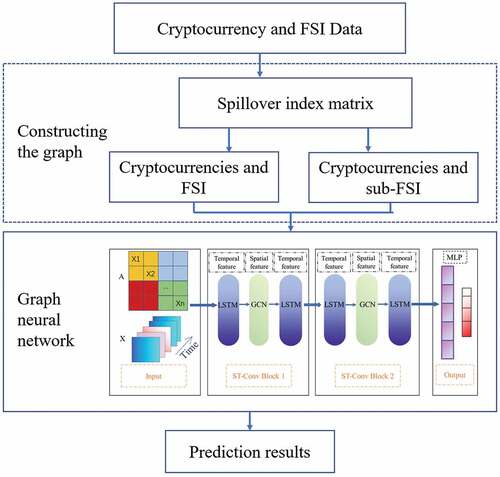
Table 1. Parameter settings of the deep learning methods.
Table 2. Comparing prediction errors of GNN using FSI with other models.
Figure 2. Training loss of the forecasting steps.
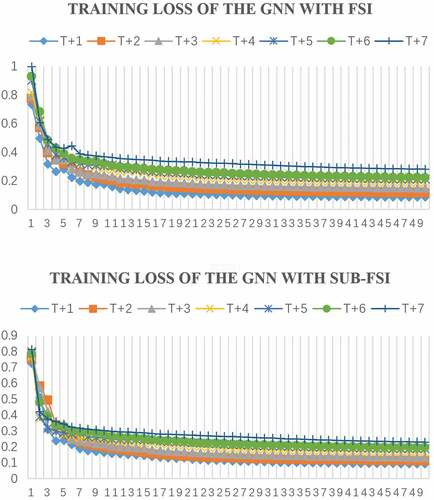
Table A1. Variable definition and summary statistics.
Table A2. Spillover index matrix with FSI.
Table A3. Spillover index matrix with sub-FSI.
Figure A1. Structural of prediction graph with FSI and with sub-FSI.
Note: The one-way arrow shows time series effect and two-way arrow represents bilateral relationship between two variables.
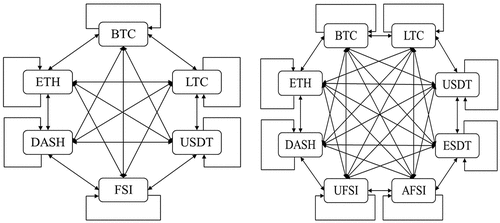
Table A4. The definitions of MAE, MAPE, and RMSE.
Table A5. Robustness check of using the matrix obtained by Granger causality and Bayesian graphic.
Figure A2: Comparison of the predicted prices of the cryptocurrencies between with FSI and sub-FSI.
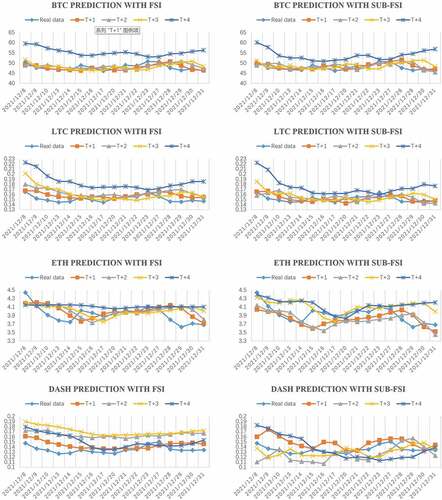
Table A6. Sensitivity check of excluding the FSI and USDT.