Figures & data
Figure 1. Transitions that change the censored headcount ratio.
Notes: A worker can have: i) a precarious job and be deprived in j (PD); ii) a secure job but be deprived in j (SD); iii) a precarious job but not be deprived in j (PN); or iv) a secure job and not be deprived in j (SN). Blue arrows are transitions between  and Red arrows are transitions between and Green arrows are transitions between and
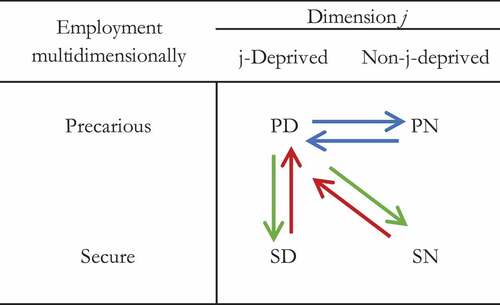
Table 1. Precarious employment insecurity dimensions, indicators and cut-offs.
Figure 2. Evolution of the multidimensional PE Index (Mpe), 2004/05 – 2019/20.
Note: Multidimensional PE index defined by four dimensions, uniform weights and K = 2.
Source: Authors’ calculations based on the Social Protection Survey.
Table 2. Multidimensional PE index by workers dynamics subgroups.
Figure 3. Contribution of each dimension to MPE in three workers dynamics subgroups by gender.
Source: Authors’ calculations using the six waves of EPS, 2004/05–2019/20.
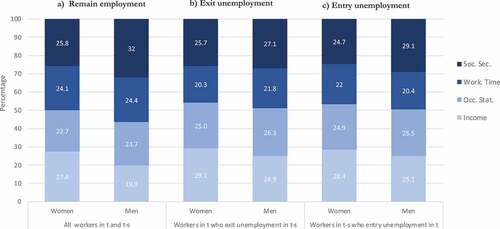
Figure 4. Mpe index dynamics by gender during different economic periods.
Source: Authors’ calculations based on the Social Protection Survey.
Note: Both subsamples are individuals who had a job in the two waves.
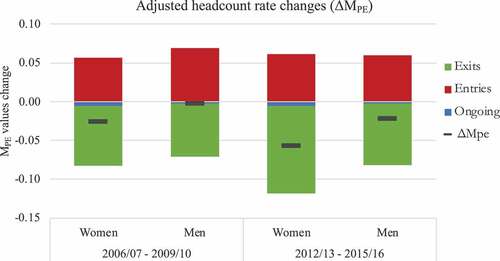
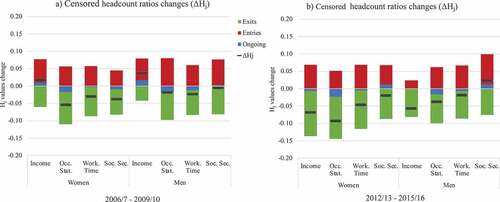
Figure 5. Hj dynamic of each PE dimension by gender during different economic periods.
Source: Authors’ calculations based on the Social Protection Survey.
Note: Both subsamples are individuals who had a job in the two waves.