Figures & data
Table 1. Share of businesses with material bottlenecks by sector in percent (average share for April 2021 to January 2022).
Figure 1. Share of businesses with material bottlenecks, January 1991 to January 2022 (in %).
Source: Ifo surveys of the economic situation
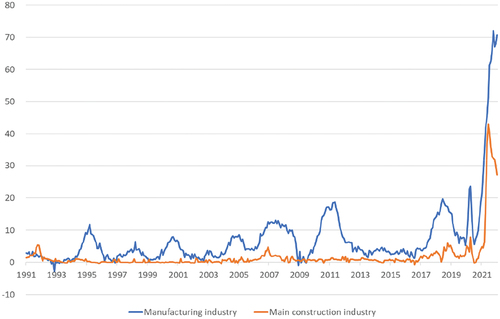
Figure 2. Course of seasonally adjusted labour market parameters for the manufacturing industry and the construction industry in number of persons (January 2017 to January 2022).
Source: German Federal Employment Agency statistics
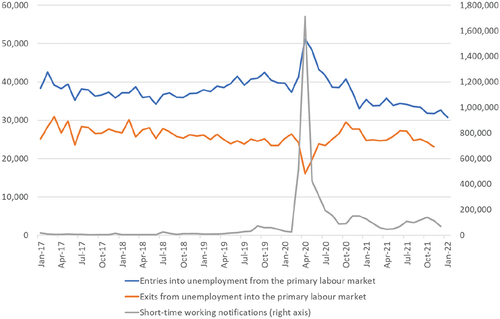
Table 2. Effects of the material shortage indicator on labour market dimensions (in %).
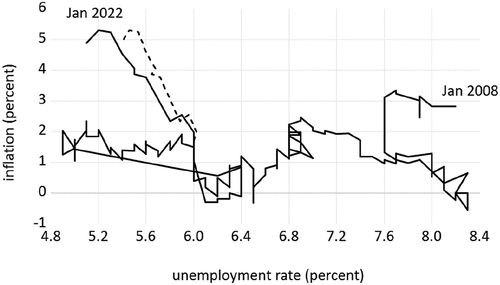
Figure 3. The Phillips curve in Germany since January 2008.
Notes: The solid line shows the unemployment rate and CPI inflation from January 2008 until January 2022. The dashed line shows the alternative development since April 2021 including the short-time work effect from our counterfactual scenario calculation. Sources: destatis, German Federal Employment Agency statistics.