
Figures & data
Figure 1. Truncated domain .
![Figure 1. Truncated domain Ω=[Smin,Smax]×[0,vmax].](/cms/asset/cbf6adf1-49c5-4fb1-9167-9d347403b471/ramf_a_2125884_f0001_oc.jpg)
Figure 2. Domain after the transformation
.
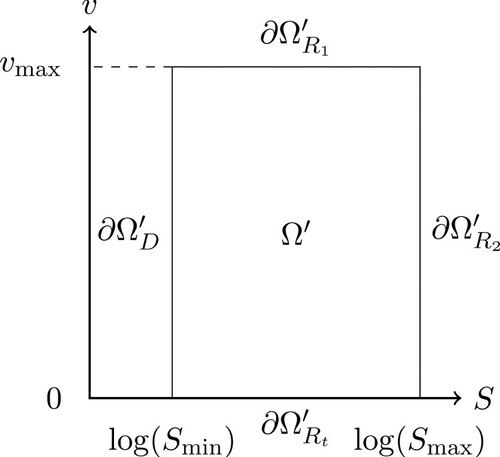
Figure 3. Domain with parameter values
,
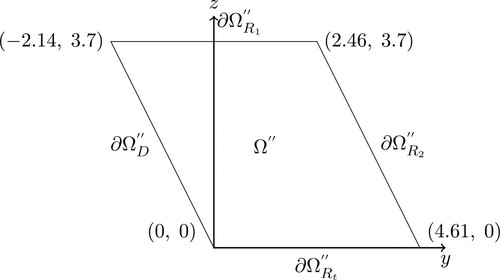
Figure 4. Value of a long butterfly position at t = 0 with T = 0.5, K = 50 and control set .
![Figure 4. Value of a long butterfly position at t = 0 with T = 0.5, K = 50 and control set L=[−2.4,−1.6].](/cms/asset/a79afa10-bd78-4be6-a3b4-a4635765262c/ramf_a_2125884_f0004_oc.jpg)
Figure 5. Measurement of the effect of nonlinearity for a long butterfly position at with T = 0.5, K = 50 and control set
. (a) Selected optimal control; which are throughout at the extreme points of the control set, (b) difference between solutions of a nonlinear problem and linear evolution problem with a fixed control
.
![Figure 5. Measurement of the effect of nonlinearity for a long butterfly position at t≈0.39 with T = 0.5, K = 50 and control set L=[−2.4,−1.6]. (a) Selected optimal control; which are throughout at the extreme points of the control set, (b) difference between solutions of a nonlinear problem and linear evolution problem with a fixed control λ=−2.4.](/cms/asset/71a81cd6-9890-4c6a-9504-6b44f389a3c9/ramf_a_2125884_f0005_oc.jpg)
Figure 6. Measurement of effect of a diameter of a control set on the value function and its derivative. Control sets are symmetrical and centred at , measurements were made at t = 0. (a) Comparison of
and
at
, (b) comparison of
and
at
, (c) comparison of
and
at
, (d) comparison of
and
at
.
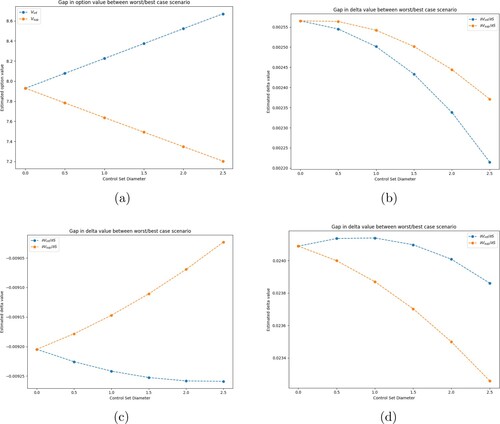
Figure 7. Comparison of plots of at time t = 0 with control set
. (a) Call option, (b) butterfly option.
![Figure 7. Comparison of plots of δ(Vsup−Vinf)/δS at time t = 0 with control set [−2.5,0.0]. (a) Call option, (b) butterfly option.](/cms/asset/99a150aa-a445-4b0d-be94-684982cfb406/ramf_a_2125884_f0007_oc.jpg)