Figures & data
Figure 1. Patient-specific iPSCs express hallmark pluripotency markers. Five days after passaging, iPSC colonies from all representative lines express hallmark pluripotency cell surface markers TRA-1–60, TRA-1–81 and SSEA4. Colonies do not express murine pluripotent stem cell surface marker SSEA1. Nuclei stain positive with DAPI. Images taken at 10#x0FBE; magnification.
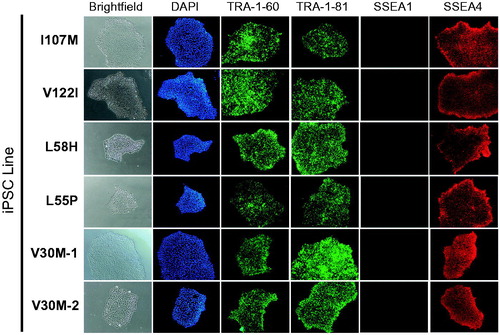
Table 1. Clinical data associated with ATTR amyloidosis patient-derived iPSCs.
Figure 2. Feeder-free, chemically defined differentiation protocol for generating hepatocyte-like cells (HLCs) from patient-specific iPSCs. Schematic depicts representative photomicrographs at multiple stages of hepatic differentiation. Major cytokines included at each stage of the differentiation process are noted.
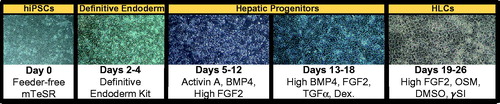
Figure 3. Robust generation of definitive endoderm cells from patient-specific iPSCs. After 5 d of directing iPSCs toward definitive endoderm, the majority of cells exhibit robust co-expression of the key markers of this developmental stage, CXCR4 and c-Kit. Undifferentiated cells (right) express c-Kit, but not CXCR4.
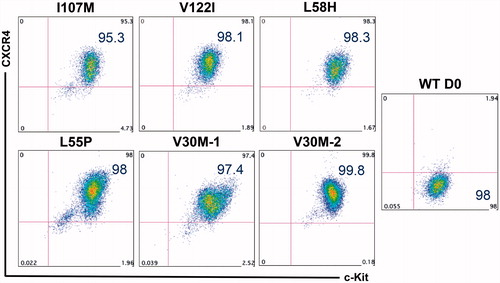
Figure 4. iPSC-derived HLCs upregulate hallmark hepatic markers and downregulate pluripotency markers. (A) On day 26 of hepatic differentiation to HLCs, qRT-PCR analyses demonstrate marked upregulation of hepatic marker genes ALB, TTR, AFP, HNF4A and alpha-1 antitrypsin (AAT) accompanied by downregulation of the pluripotency marker OCT4. Human fetal and adult liver controls are included for comparison. (B) Day 26, HLCs exhibit protein-level expression of intracellular hepatic markers AFP and FOXA1 by flow cytometry.
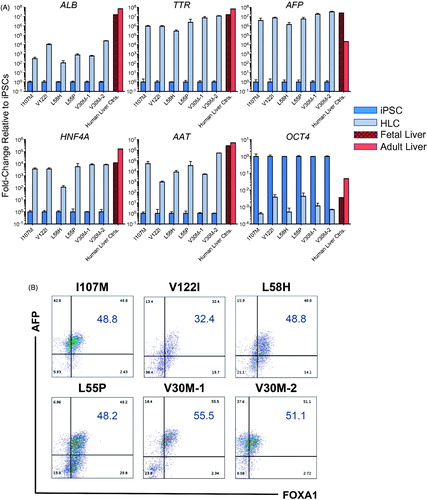
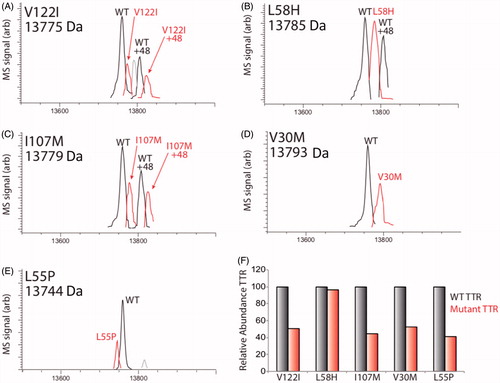
Figure 5. LC/MS characterization of TTR mutants secreted from HLCs. (A–E) LC/MS deconvolution spectra showing recovery of WT TTR or specific TTR mutant from TTR IPs of conditioned media prepared on iPSC-derived HLCs. A +48 peak was observed in some TTR IPs for both WT and mutant variants, reflecting oxidation of TTR. The mass of each mutant is shown, while the mass of WT TTR was determined to be 13,761±2 Da. Additional peaks observed in (A) and (C) likely depict a doubly oxidized TTR species and unidentified species of negligible abundance, respectively (Note: Bovine TTR (13555) was detected in these experiments, but we omitted this peak from the above spectra for clarity.). (F) Bar graph showing the relative recovery of mutant TTR compared with WT TTR (right and left bars, respectively) in the IPs shown in panels A–E. The relative recovery of oxidized mutant TTR relative to oxidized WT TTR showed similar recoveries, but are not included here.