
Figures & data
Table 1. Demographics and baseline characteristics by region, disease onset and prior treatment with TTR Stabilizers.
Table 2. Baseline characteristics by TTR mutation (> =5% prevalence in NEURO-TTR).
Figure 1. Relationship of NT-proBNP to LV Septal Wall Thickness.
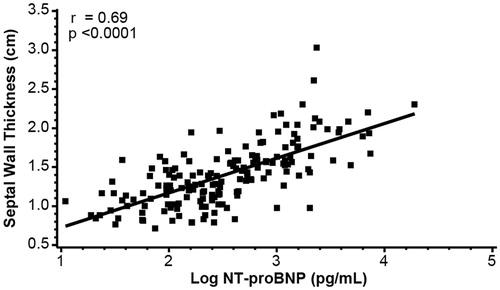
Figure 2. Quality of Life Corresponds to ATTRm Disease Severity (A) mNIS +7 composite score increases with worsening Norfolk QoL-DN score. The dotted horizontal line refers to the average Norfolk QoL-DN score in healthy volunteers (n = 12) [Citation27]. (B) PND stage advances with worsening SF-36 PCS. The dotted horizontal line refers to the average SF-36 PCS score in the general US population [Citation28]. (C) Norfolk Total Score increases with worsening SF-36 PCS.
![Figure 2. Quality of Life Corresponds to ATTRm Disease Severity (A) mNIS +7 composite score increases with worsening Norfolk QoL-DN score. The dotted horizontal line refers to the average Norfolk QoL-DN score in healthy volunteers (n = 12) [Citation27]. (B) PND stage advances with worsening SF-36 PCS. The dotted horizontal line refers to the average SF-36 PCS score in the general US population [Citation28]. (C) Norfolk Total Score increases with worsening SF-36 PCS.](/cms/asset/d856d063-3ad3-43f9-98ea-42226d7f95e1/iamy_a_1503593_f0002_c.jpg)
Supplemental material