
Figures & data
Figure 1. Outlining of the experimental design. Mice were divided into five groups (capital letter) and inflammatory stimulus was given by subcutaneous injection of AgNO3 (1%, 0.2 mL). Amyloid enhancing factor (AEF) and/or liposomes (Lipo) were injected intravenously. Sac indicates the time point at which the mice were sacrificed; n indicates the number of mice in each group. Arrows indicate injection time point. Shorter time points were studied in groups D, E and F in a separate experiment of 72 mice in which three mice were sacrificed between 0.5 and 72 h after the treatment at day 0.
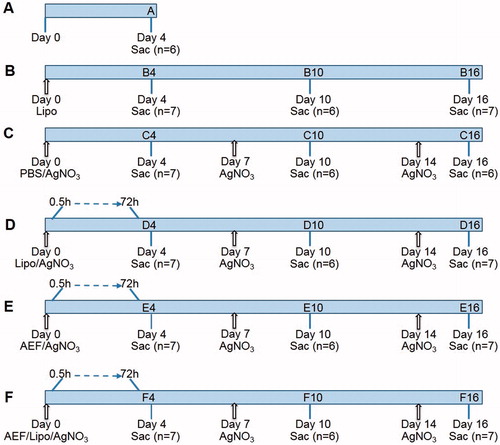
Table 1. Antibodies used for immunodetection.
Figure 2. TEM images of liposomes and amyloid fibrils negatively stained with uranyl acetate. (A) Preparation of AEF showing unbranched fibrils of different length (black arrow). (B) Preparation of liposomes (Lipo) with rounded vesicles of varying size. (C) Mixture of liposomes and AEF showing affinity of amyloid fibrils to liposomes. The white arrow indicates the perpendicularly arrangement of fibrils to the liposomes membrane.
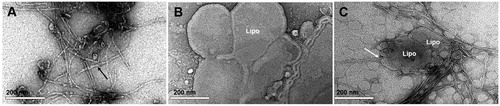
Figure 3. Serum concentration of SAA is increased in response to inflammation. SAA concentration was measured in serum from each experimental group outlined in . At start of the experiment and after 7 and 14 days, mice were injected with AgNO3 (groups C–F). Capital letters indicate the groups and the numbers indicate the day at which the mice were sacrificed. Note that mice sacrificed at day 4 were injected with AgNO3 4 days earlier, while mice sacrificed after 10 and 16 days have been injected 3 and 2 days earlier, respectively. Each box presents the values from 5 to 6 mice. The horizontal line in each box represents the median. *p ≤ 0.01.
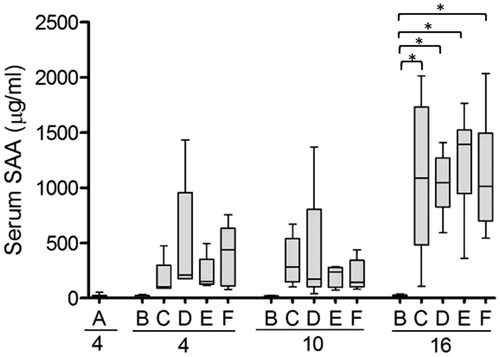
Figure 4. Liposomes and AEF enhance the AA amyloid formation. (A) Spleen sections from AA amyloid mice were stained with Congo red and amyloid was graded from 0 (no amyloid) to 4+ (intensive amount of amyloid; see Ref. [Citation22] for details). Capital letters indicate groups and numbers indicate the duration of experiment (the groups are outlined in ). (B) SAA/AA immunoblot of spleen homogenates from mice treated with AgNO3 (group C10), liposomes and AgNO3 (group D10), AEF and AgNO3 (group E10), and AEF/ liposomes and AgNO3 (group F10) sacrificed after 10 days. Immunodetection of SAA/AA revealed three bands between 8 and 12 kDa while no reactivity was detected in group A (untreated mice) and group C (mice injected with AgNO3 only). (C) Liver sections were stained with Congo red and examined for the presence of amyloid; positive staining (grey bar), and negative straining (white bar).
![Figure 4. Liposomes and AEF enhance the AA amyloid formation. (A) Spleen sections from AA amyloid mice were stained with Congo red and amyloid was graded from 0 (no amyloid) to 4+ (intensive amount of amyloid; see Ref. [Citation22] for details). Capital letters indicate groups and numbers indicate the duration of experiment (the groups are outlined in Figure 1). (B) SAA/AA immunoblot of spleen homogenates from mice treated with AgNO3 (group C10), liposomes and AgNO3 (group D10), AEF and AgNO3 (group E10), and AEF/ liposomes and AgNO3 (group F10) sacrificed after 10 days. Immunodetection of SAA/AA revealed three bands between 8 and 12 kDa while no reactivity was detected in group A (untreated mice) and group C (mice injected with AgNO3 only). (C) Liver sections were stained with Congo red and examined for the presence of amyloid; positive staining (grey bar), and negative straining (white bar).](/cms/asset/95f78e60-4f4d-45c4-9b16-57625f5a3805/iamy_a_1576606_f0004_b.jpg)
Figure 5. RPMs but not MMZMs are increased in response to all treatments. Inflammatory response in mice was induced by AgNO3 injections and amyloid formation was stimulated by amyloid enhancing factor (AEF) and/or liposomes (Lipo) according to the outline in . RPMs and MMZMs were identified using specific antibodies against F4/80 and MOMA-1, respectively. Results are presented as fold change of untreated animals. Each bar represents the mean value for 6–7 mice. Grey bars are RPMs and white bars are MMZMs. Horizontal dotted line shows the baseline for untreated control (group A). *p ≤ 0.01, **p ≤ 0.001, ***p ≤ 0.0001.
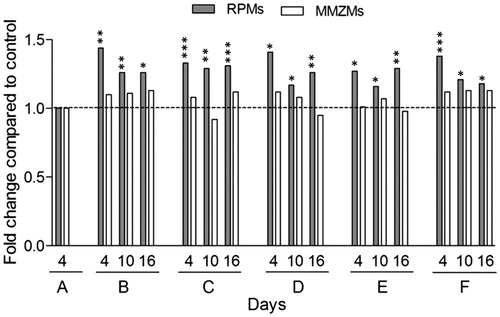
Table 2. Quantification of MZMs correlated to grading of spleen amyloid.
Figure 6. (A) Expression of IL-1β in spleen in the mouse model of AA amyloidosis. Spleen sections from inflamed mice treated with AEF and/or liposomes, sacrificed after 1, 6, 24 and 72 h were stained for IL-1β. Areas of white pulp (WP) are marked with a dotted line. IL-1β was detected in the red pulp after 1 h and increased over time. IL-1β increase was more rapid in inflamed mice treated with AEF. (B) Expression of IL-1β in splenic macrophages. Spleen sections from mice treated with AEF/liposomes and AgNO3, sacrificed after 6 h were double labelled for IL-1β and MZMs, MMZMs or RPMs, respectively. Merged images are shown with macrophage marker (green), IL-1β (red) and colocalization (yellow) indicated by arrows. WP: white pulp, RP: red pulp.
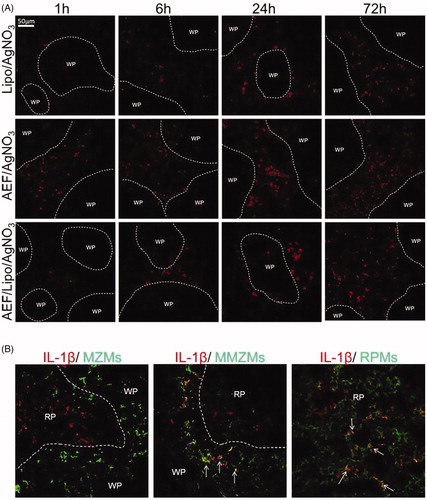
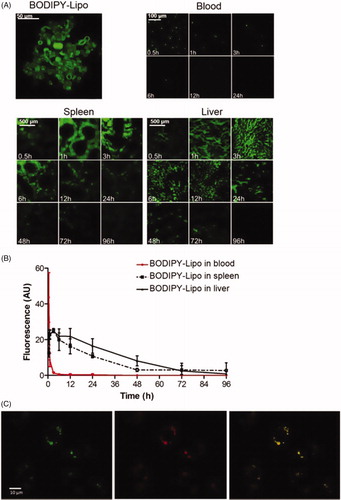
Figure 7. Fate of the liposomes. Mice were injected with BODIPY-fluorescence-labelled liposomes (BODIPY-Lipo) and sacrificed after indicated time points. (A) Blood smears and sections from spleen and liver were examined in a confocal microscope. Images represent the morphology of isolated BODIPY-Lipo before injection, the presence of BODIPY-Lipo in blood smears, spleen and liver sections, respectively. (B) Quantification of BODIPY-Lipo-induced fluorescence in blood, spleen and liver. (C) Liposomes colocalized with lysosomes in the macrophage cell line J774A.1. Cells were incubated with liposomes containing FITC (FITC-Lipo) for 2 h followed by incubation with Lysotracker red for 10 min. Images show FITC-Lipo in green (left), lysosomes in red (centre), and merged images presenting colocalization of liposomes with lysosomes in yellow (right).