Figures & data
Table 1. Baseline characteristics of patients at study entry.
Figure 1. Left ventricular Mass on MRI. Mean decrease in left ventricular mass compared to baseline was 0.54% (n = 10), 8.5% (n = 10), and 11.5% (n = 8) at 1, 2, and 3 years respectively.
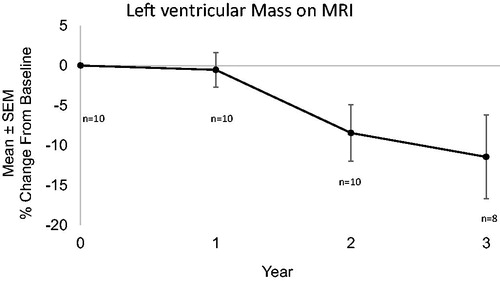
Figure 2. Echocardiogram and MRI of a subject with hereditary ATTR cardiomyopathy: Top (Echocardiogram): IVS decreased from 1.8 cm (left) at baseline to 1.4 cm at 2.5 years (right). Bottom (MRI): LVM decreased from 331 grams at baseline (left) to 149 grams at 3 years (right).
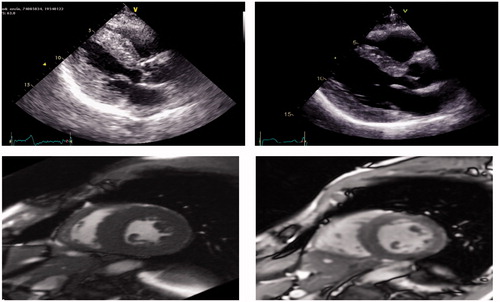
Figure 3. Interventricular septal thickness on Echo compared to baseline (n = 20) was stable at one year (n = 20) and decreased by 0.14 cm (n = 16) at 2 years and 0.3 cm (n = 14) at 3 years (p = .019) in all patients (hereditary and wild-type) as shown by the center line. The decrease in wall thickness was similar in the wild-type patients (bottom line) and the hereditary patients (top line).
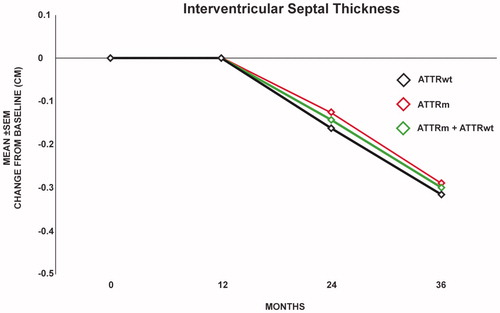
Figure 4. Center line: 6MWT in patients tested at 1, 2, and 3 years. Mean 6MWT increased by 10.63 (n = 19), 22.2 (n = 14) and 16.5 (n = 12) meters compared to baseline at 1, 2, and 3 years respectively. Top line: 6-MWT in ATTRm patients. Mean 6-MWT increased by 29.3 (n = 8), 40.9 (n = 8) and 50.2 (n = 7) meters at 1, 2, and 3 years respectively. Bottom line: 6-MWT in ATTRwt patients. Mean 6MWT decreased by 3 (n = 11), 2.6 (n = 6), and 31.7 (n = 5) metres compared to baseline at 1, 2, and 3 years respectively.
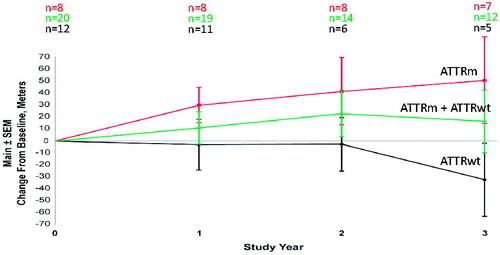
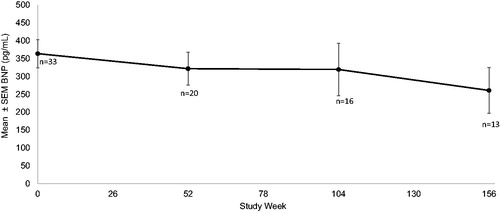
Figure 5. Mean BNP decreased from 353.8 pg/dl (n = 33) at baseline to 321.7 pg/dl (n = 20), 319.4 pg/dl (n = 16) and to 260.8 pg/dl (n = 14) at 1, 2, and 3 years respectively.