Figures & data
Figure 1. Carpal tunnel tissue used for quantitative proteome profiling. Formalin-fixed and paraffin-embedded carpal tunnel tissue specimens with ATTR amyloid were stained with haematoxylin and eosin (A), immunohistochemically with antibodies directed against transthyretin (B) and complement CO9 (C), and with Congo red (D–F). Congo red-stained tissue sections were scanned using a Hamamatsu NanoZoomer 2.0 RS scanner in sequential bright field and fluorescence mode (D). Digital image analysis assessed amyloid load in amyloid-enriched (21.1%; E) and amyloid-depleted (1.8%; F) areas, which were subsequently microdissected manually and forwarded to quantitative proteome profiling. Original magnifications 1.8-fold.
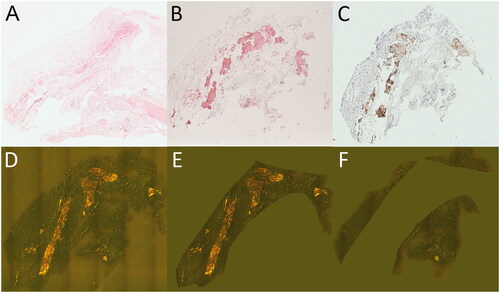
Figure 2. Transthyretin abundance correlates with amyloid associated proteins. A histogram shows the distribution of Pearson’s correlation coefficients for log2 LFI profiles of 970 proteins compared to the profile of transthyretin (TTR) (A). The number of profiles showing a significant similarity are indicated as stacked columns. The distribution of average label-free intensities compared to Pearson’s correlation coefficients of profiles against TTR is shown in (B). Proteins with significant correlation FDR ≤ 1% and ≤ 5% are shown in green and yellow, respectively. The 14 proteins previously detected in ATTR of affected synovium are highlighted in red font. Highly abundant proteins with no correlation to TTR are indicated by blue colour. Three proteins with a strong negative correlation are orange. The distribution of log2 label-free intensity values for several proteins, and the corresponding distribution of LFI values are shown in (C,D), respectively.
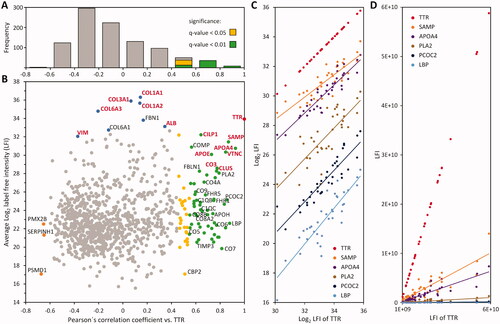
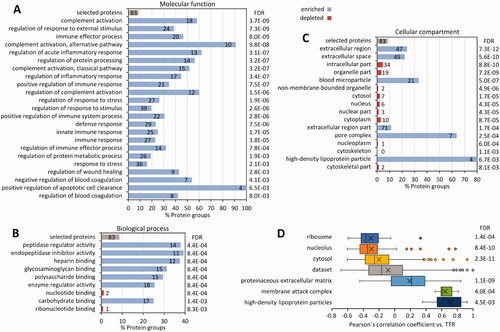
Figure 3. GO term enrichment analyses. The annotations of 83 transthyretin-associated proteins were compared to the dataset of 970 quantified proteins. Columns represent the percentage of proteins in the specified category compared to the dataset. The number of proteins annotated with the GO term is indicated inside the graph, FDR values are added to the right. (A) Molecular functions. (B) Biological process. (C) Cellular compartment. (D) Results of 1 D annotation enrichment.