Figures & data
Table 1. Baseline demographics and disease characteristics of patients across the NIS quartiles and the mITT population.
Table 2. NIS, R-ODS, 10-MWT, grip strength, and Norfolk QOL-DN at baseline and 18 months by baseline NIS quartiles.
Figure 1. Mean mNIS+7 (A) and NIS (B) scores at baseline, 9 months, and 18 months according to baseline polyneuropathy group. BL: baseline; mNIS+7: modified Neuropathy Impairment Score+7; m: months; NIS: Neuropathy Impairment Score; Q: quartile; SEM: standard error of the mean.
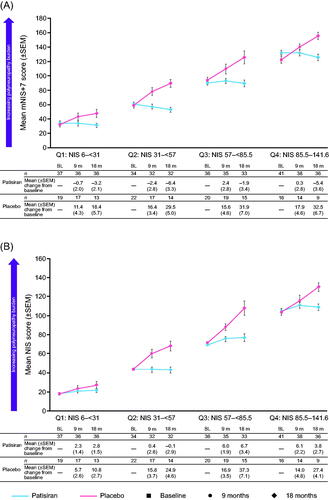
Figure 2. Mean R-ODS score at baseline and 18 months according to baseline polyneuropathy group. BL: baseline; m: months; NIS: Neuropathy Impairment Score; Q: quartile; R-ODS: Rasch-built Overall Disability Scale; SEM: standard error of the mean.
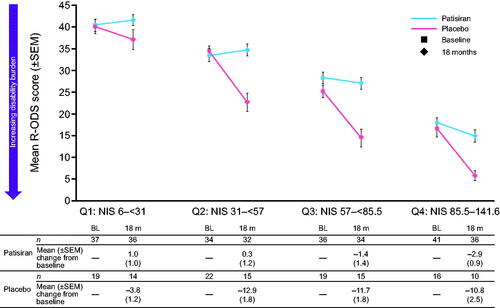
Figure 3. Mean 10-MWT, in m/s, at baseline and 18 months according to baseline polyneuropathy group. *n = 14. 10-MWT: 10-meter walk test; BL: baseline; m: months; m/s: meters per second; NIS: Neuropathy Impairment Score; Q: quartile; SEM: standard error of the mean.
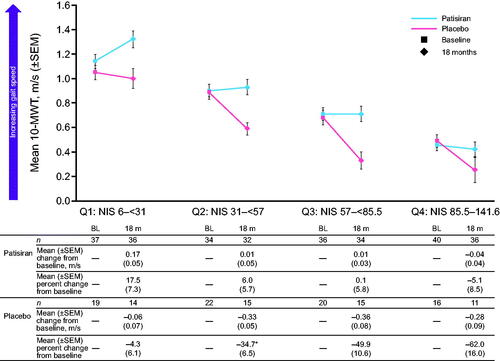
Figure 4. Mean grip strength, in kg, at baseline and 18 months according to baseline polyneuropathy group. *n = 32; †n = 10. BL: baseline; m: months; NIS: Neuropathy Impairment Score; Q: quartile; SEM: standard error of the mean.
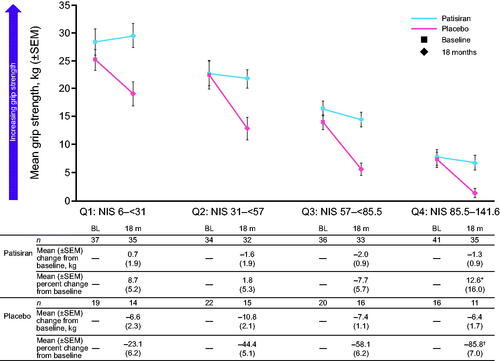
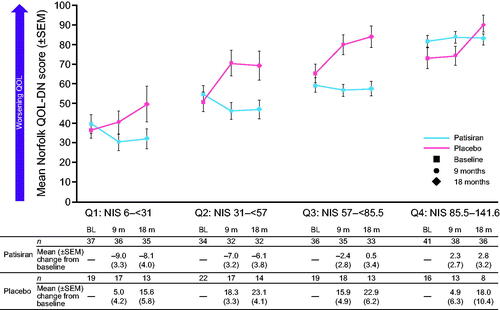
Figure 5. Mean Norfolk QOL-DN scores at baseline, 9 months, and 18 months according to baseline polyneuropathy group. BL: baseline; m: months; Norfolk QOL-DN: Norfolk Quality of Life-Diabetic Neuropathy; NIS: Neuropathy Impairment Score; Q: quartile; QOL: quality of life; SEM: standard error of the mean.