Figures & data
Figure 1. A schematic outline of the sample cohort and the proteomic results. Seventy-eight biopsies collected as EMBs from patients with cardiac amyloidosis were prepared for proteomic analysis. Three biopsies were excluded from the protocol due to low protein amount and unclear clinical diagnoses, respectivly. The amyloid subtype in each specimen was attributed to any of the four main amyloid precursor proteins which may affect the heart: LC λ, LC κ, TTR and SAA. Out of 75 analysed biopsies, 65 biopsies were above the diagnostic threshold of 70% for the dominating amyloid precusor protein. Of theses 65 cases, 61 cases were in accordance with previously assigned clinical diagnoses, whereas 4 cases were in discordance with the previously assigned diagnoses.
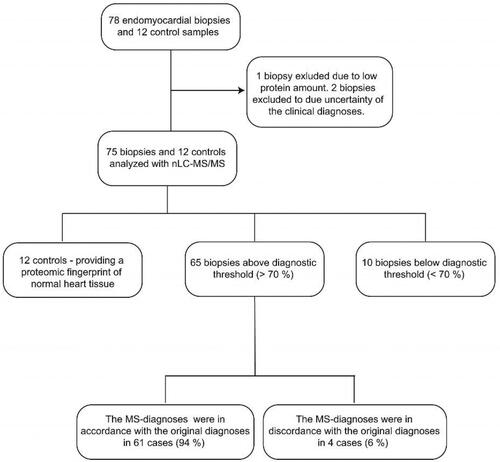
Figure 2. Grading of amyloid content in fresh frozen endomyocardial biopsy specimens after staining with Congo red. (A-D) The CR-stained sections viewed under bright field microscopy. (E-H) The CR-stained sections viewed by fluorescence microscopy and Texas red filter (yellow). The biopsy specimens show varying degree of amyloid deposition, 0 = 0%, + = <5%, ++ = 5-20%, +++ = >20%.
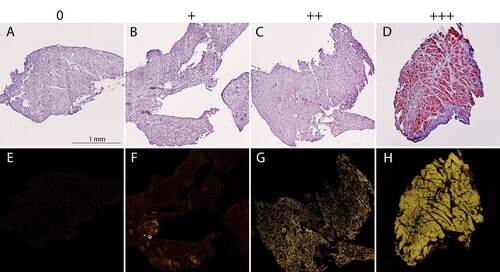
Figure 3. Distribution of the proteomic-based amyloid-typing. (A) TTR was assigned as the pathogenic amyloid-precursor protein in 32 cases. LC λ and LC κ were assigned in 28 and 5 cases, respectively. SAA was not assigned as the amyloid-protein in any of the cases. (B) Relative intensity (%) of the sum of four amyloid proteins (TTR, LC λ, LC κ and SAA) in relation to the total protein intensity in individual control and patient samples, coloured according to the proteomic results. Mean relative intensities for controls and amyloid samples were 0.083% and 1.93%, respectively. Unpaired student T-test. p < 0.001 (****).
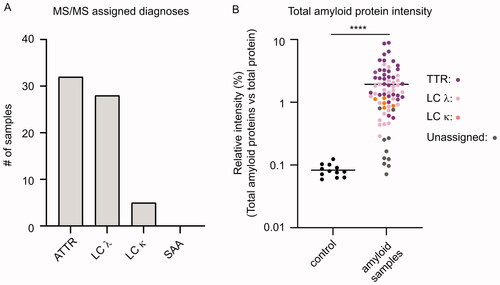
Table 1. Detailed results of the protomic-based diagnoses compared to the clinical diagnoses of cardiac amyloid patients.
Figure 4. Influence of the amyloid score on the method’s diagnostic capability. (A) Relative intensity (%) of the dominating single amyloid protein in relation to the summed total intensity of the four amyloid proteins (TTR, LC λ, LC κ and SAA). Samples from ten cases (indicated in the figure) out of 75 were below the diagnostic threshold of 70%. Five samples had an amyloid score of 0, while four samples had a score of 1+. A single undiagnosed case (S71) had an amyloid score of 2+. (B) The relative intensity (%) of the four single amyloid precursor proteins in relation to the summed total intensity of the four amyloid proteins (TTR, LC λ, LC κ and SAA) in patient sample S71. The two most abundant amyloid proteins were LC λ and LC κ, with a relative intensity of 56.7% and 39.1%, respectively.
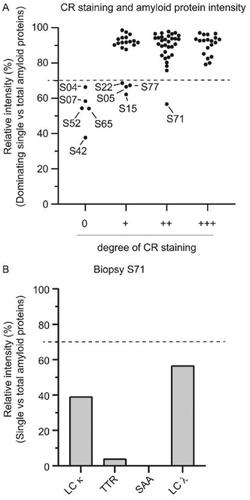
Figure 5. Cases with discordant clinical and proteomic based diagnoses (A) The proteomic based amyloid typing were discordant with the clinical diagnoses in four cases (S01, S55, S56 and S59). One case (S71) could not be unequivocally assigned with the proteomic analysis despite a clear CR staining (2+). The results from immunohistochemistry (IHC), scintigraphy (Scint.) and M-component analysis (M-comp.) are provided for each case. ‘Pos scint.’ = Scintigraphy performed with a positive result. The positive myocaridal uptake is further graded from 1 to 3 (Grade 1 (G 1): myocardial uptake < rib uptake; Grade 2 (G 2): myocardial uptake = rib uptake; Grade 3 (G 3): myocardial > rib uptake). Ambiguous M-component analysis (e.g. ‘unclear’, ‘not clear’) are denoted exactly as written in the clinical record. (B) Relative intensities (%) of the four single amyloid proteins (LC κ, TTR, SAA and LC λ) expressed in relation to the summed total intensity of the four amyloid proteins in patient samples S01, S55, S56 and S59. The proteomic based diagnoses could be unequivocally assigned in all cases.
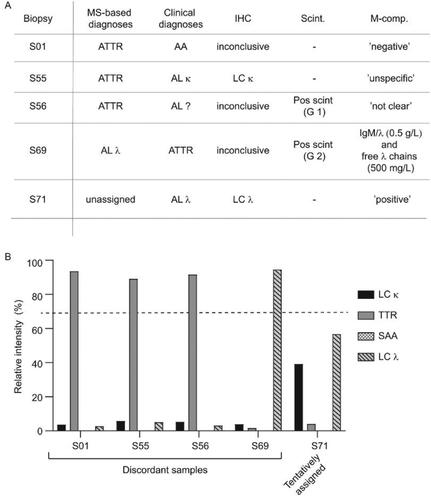
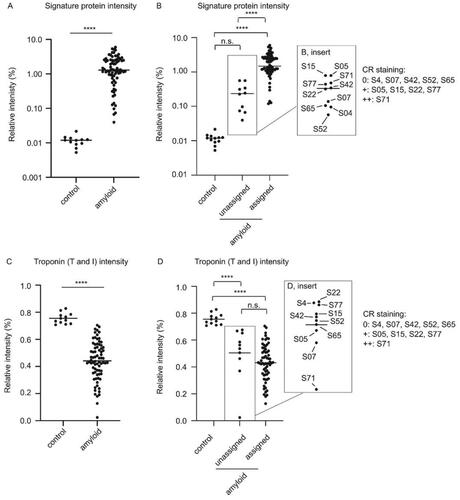
Figure 6. The amyloid signature proteins provide a useful tool for assessing amyloid levels in cardiac specimens (A) Relative intensities (%) of the sum of the three amyloid signature proteins (ApoE, SAP and ApoA-IV) expressed in relation to the total protein intensity in individual control and patient samples. Mean relative intensities for patient samples and controls were 1.77% and 0.012%, respectively. Unpaired student T-test. p < 0.001 (****). (B) Relative intensities (%) of the sum of the three amyloid signature proteins (ApoE, SAP and ApoA-IV) expressed in relation to the total protein intensity in individual control vs unassigned and assigned samples. Ordinary one-way ANOVA. Control vs unassigned not significant (p = 0.88.). Control vs assigned p < 0.001 (****), unassigned vs. assigned p < 0.001 (****). (C) Relative intensity of total troponin (T and I) expressed in relation to the total protein intensity in patient and control tissue. Mean relative intensities for controls and patients were 0.76% and 0.44%, respectively. Unpaired student T-test. p < 0.001 (****). (D) Relative intensity of total troponin (T and I) in relation to the total protein intensity in control tissue vs unassigned and assigned samples. Ordinary one-way ANOVA. Multiple comparison. Control vs unassigned p < 0.001 (****), control vs. assigned p < 0.001 (****), unassigned vs assigned not significant (p = 0.24).