Figures & data
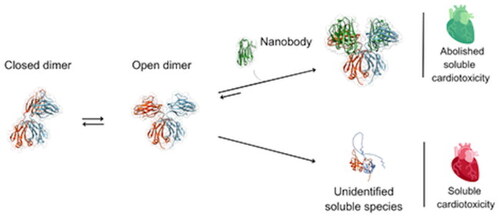
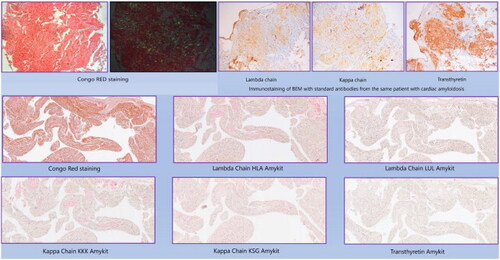
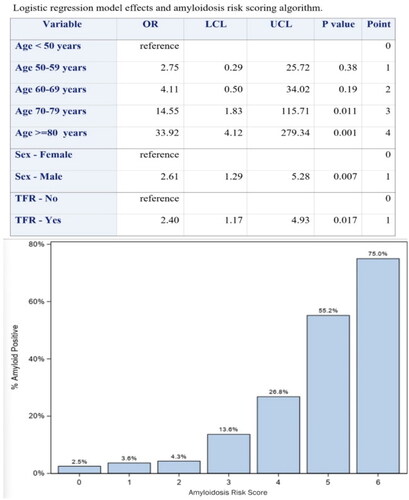
Figure 1. Cartoon showing identical maps and structures of cardiac and renal amyloid fibrils of AL55 LC.
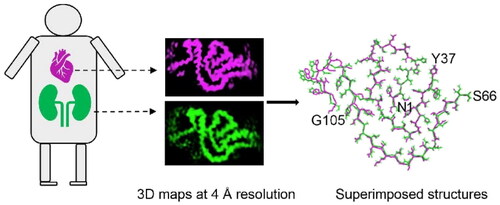
Figure 1. Kaplan Meier curve graphs showing A. all-cause mortality B. Composite death and CVRH C. CVRH free time in months D. All cause hospitalization free time in months. Patients receiving combination therapy (N = 18) were marked as red line and the total cohort of patients receiving tafamidis (N = 137) were marked as blue line, p value derived from log-rank test.
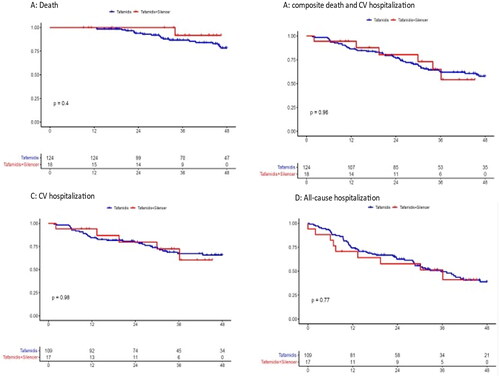
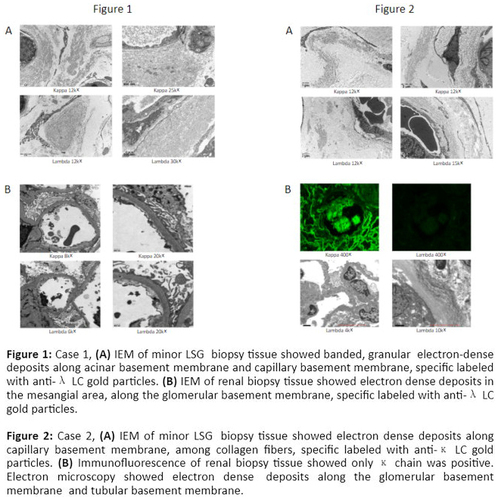
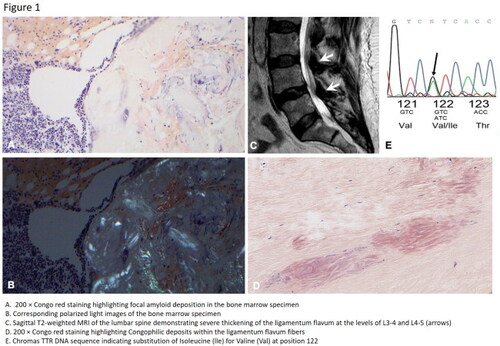
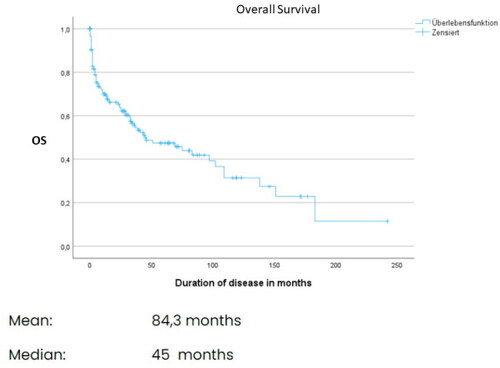
Figure 1. Time to next treatment – median TTNT was 85. Vs 71 months (p = .027 (FLC-MS negative vs. FLC-MS positive).
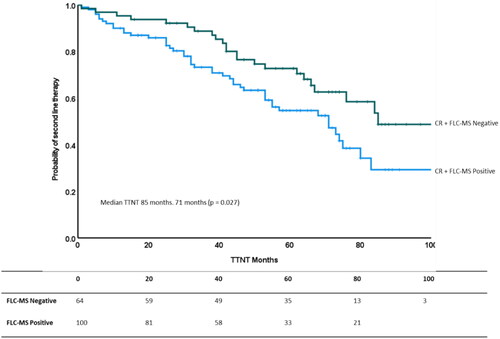
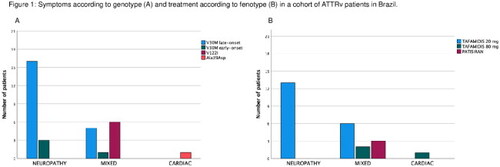
Table 1. Summary of clinical information (N = 10).
Figure 1. Sites of Loc-AL
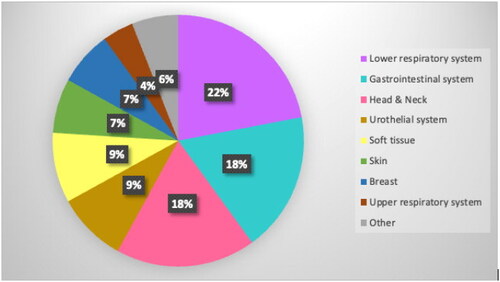
Table 1. Age and gender related to mortality.
Figure. Health-related quality of life assessed through Euro-QoL, differentiating each of the five domains in all patients and classifying them based on the time elapsed since diagnosis (less than 5 years and more than 5 year since diagnosis).
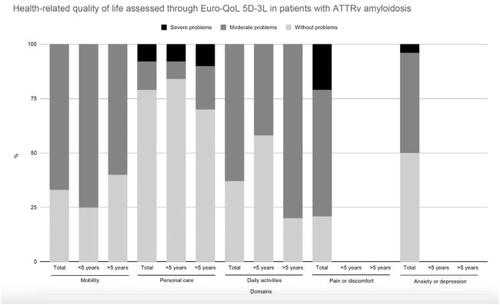
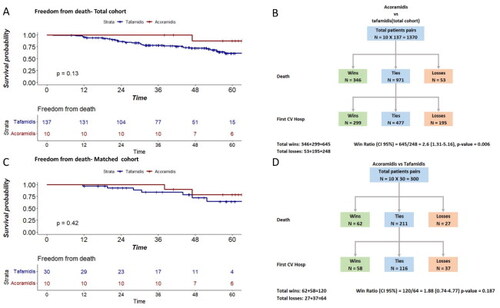
Table 1 Patient demographics and amyloid testing data.
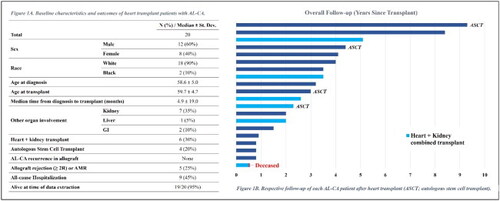
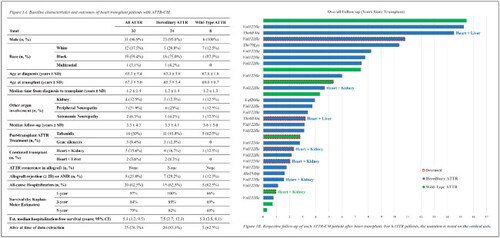
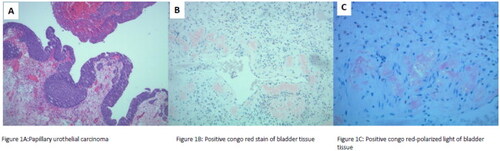
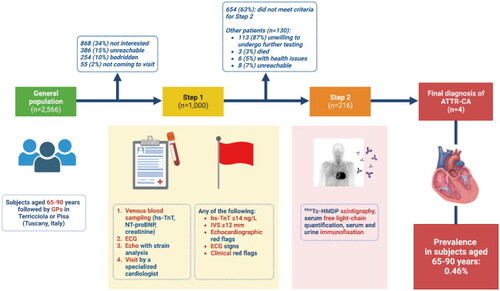
Table 1. Characteristics of patients with transthyretin amyloid cardiomyopathy classified into heart failure with preserved, mildly reduce and reduced ejection fraction.
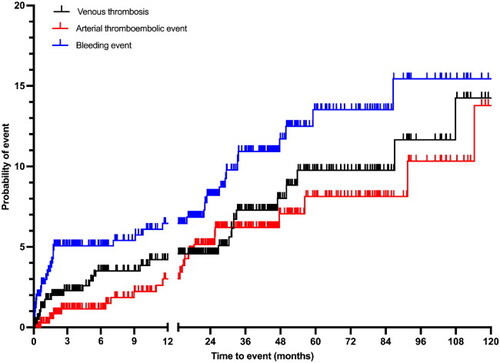
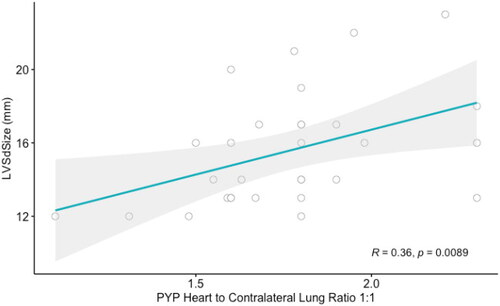
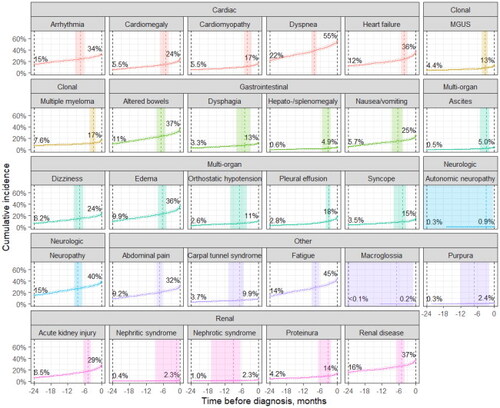
Table 1. Dual amyloid diagnoses.
Table. Baseline characteristics and efficacy/safety outcomes in patients with relapsed/refractory AL amyloidosis treated with belantamab mafodotin monotherapy.
Table 1 Baseline characteristics and efficacy/safety outcomes in patients with newly diagnosed AL amyloidosis treated with daratumumab monotherapy.
Table 1. Characteristics of six cases with dual amyloidosis in one host.
Table 1 Patient characteristics at diagnosis by phenotype in the USA and Japan.
Table 1. Clinical findings at the time of diagnosis with renal-predominant ATTRwt amyloidosis.
Table 1. Characteristics of subjects with and without skeletal muscle amyloid infiltration at autopsy.
Table 1. An exploratory analysis of clinical factors associated with early (within 1 year of diagnosis) sudden unexpected death in systemic AL amyloidosis.
Table 1. The spectrum of extracardiac tissue/organ sites where ATTRwt amyloid deposits were identified.
Table 1. Common reasons for barriers to recruitment on clinical trials from 2018 to 2023.
Figure 1. Physical Component Summary (PCS) and Mental Component Summary (MCS) scores based on results of the SF-36v2® Health Survey among patients with ATTR amyloidosis relative to the average U.S. adult.
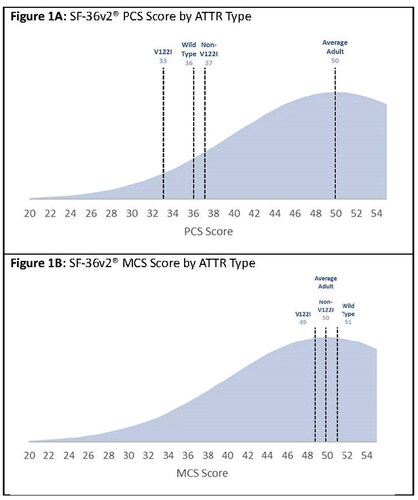
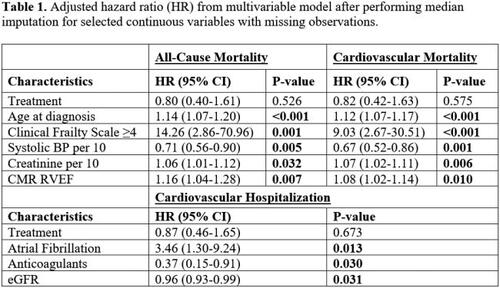
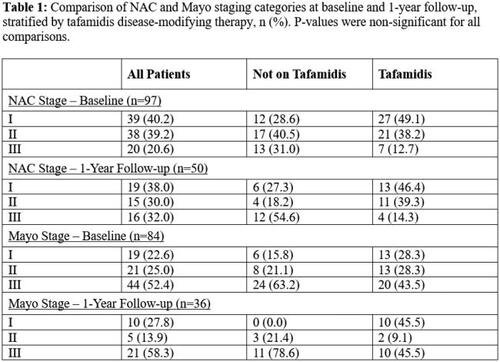
Figure 1. Congo red stain of biopsies under polarized light. Congo red stain with apple-green birefringence under polarized light of bone marrow biopsy (A) and bladder biopsy (B).
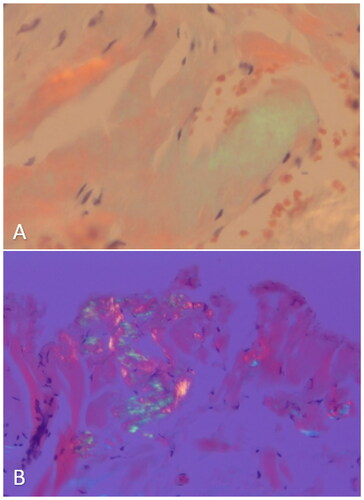
Table 1. Patient characteristics.
Table 1. Comparison of sociodemographic factors, disease characteristics, and use of ATTR therapeutics by self-reported race/ethnicity.
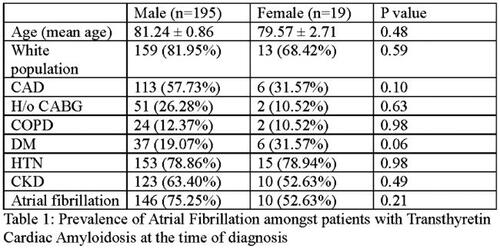
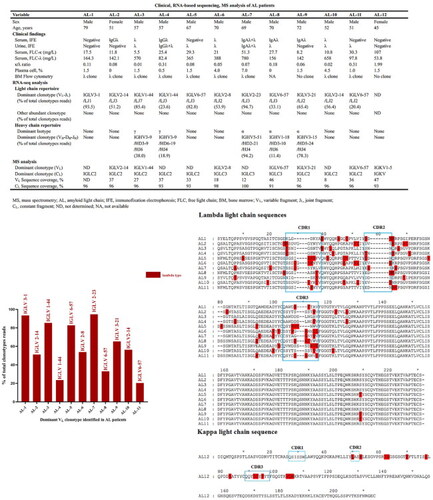
Table 1 Baseline demographics and prognostic markers stratified by Clinical Frailty Scale dichotomous score.
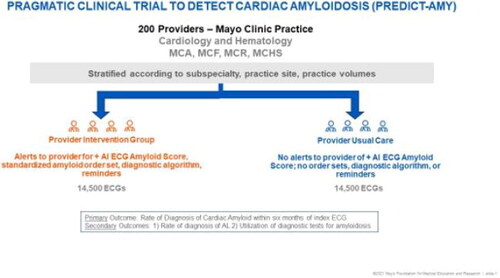
Table 1. Presenting features of systemic AL by ethnicity.
Figure: (a) Congo red-stained duodenal biopsy of small vessels. (b and c) Polarized light microscopy showing green birefringence of amyloid deposits in the vessels.

Table 1 Clinical characteristics for patients with NDALA treated with BCR at the APC.
Table 1. Clinical characteristics for patients with NDALA treated with Bortezomib Containing Regimens at the Amyloidosis Program of Calgary.
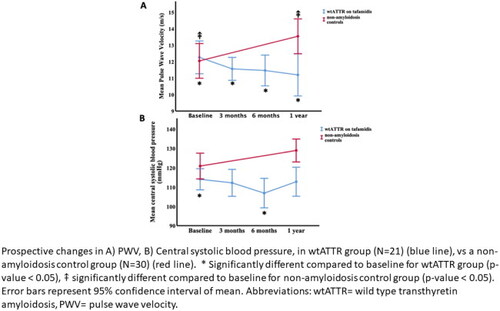
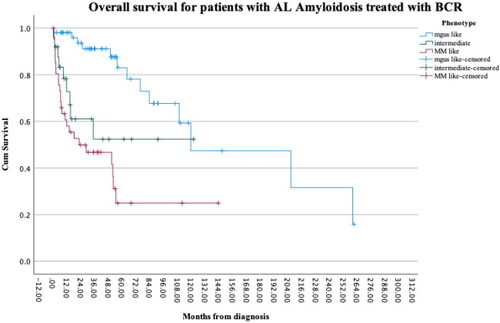
Figure 1. Overall survival (OS) for LC-MGUS based on IstopMM criteria. No differences in OS were noted (p = .7).
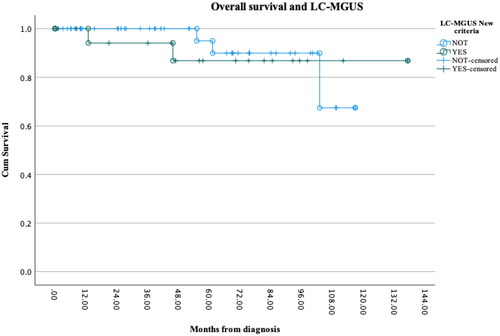
Figure 1. Mean ATTR – QOL impact scores by ATTR genotype.
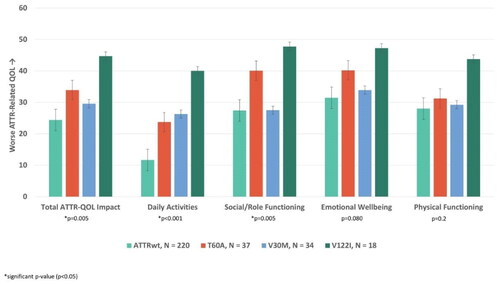
Table 1. Demographic and disease characteristics of leukocyte chemotactic factor 2 (Alect2) amyloidosis patients.
Figure 1. Transmission electron microscopy (TEM) shows immature (green arrows indicated dotted structures, magnification 25,000× and 40,000×) and mature (red arrows indicated thin, mesh-like, magnification 25,000× and 40,000×) amyloid fibrils in the cardiac extracellular matrix of ATTR mouse hearts compared to controls.
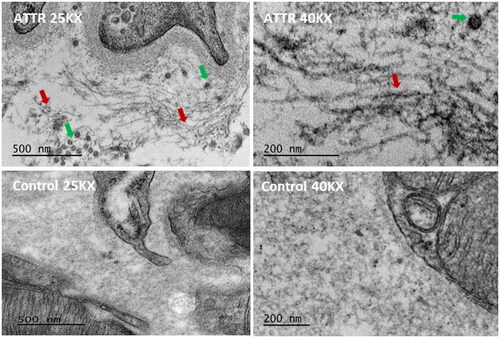
Table 1 Patient demographic and clinical characteristics of patient with AL amyloidosis recently diagnosed by survey year.
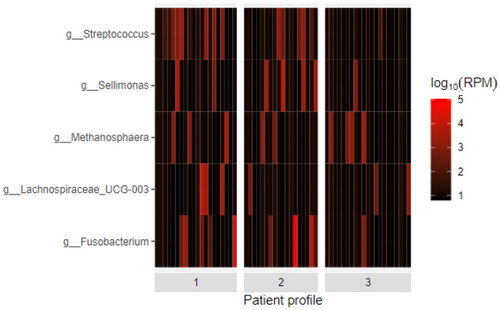
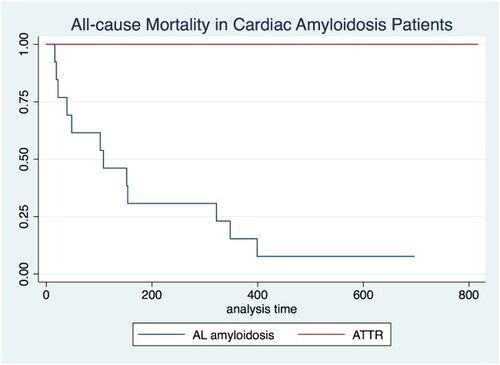
Table 1 Demographic and genetic characteristics across TTR amyloidosis randomized control trials.
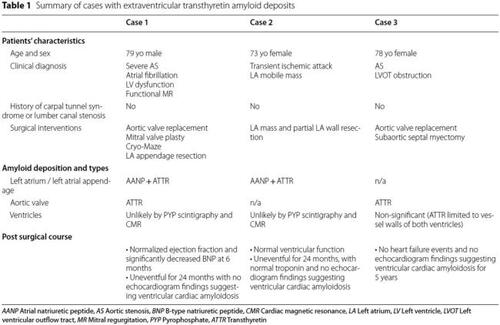
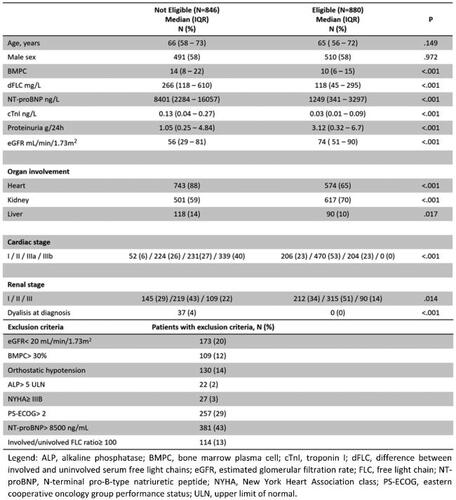
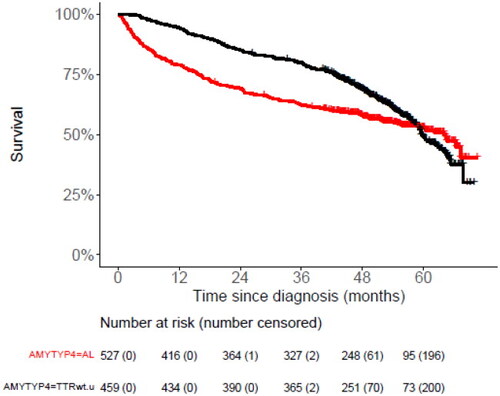
Table 1. Patient demographic and clinical characteristics of patient with AL amyloidosis recently diagnosed by survey year.
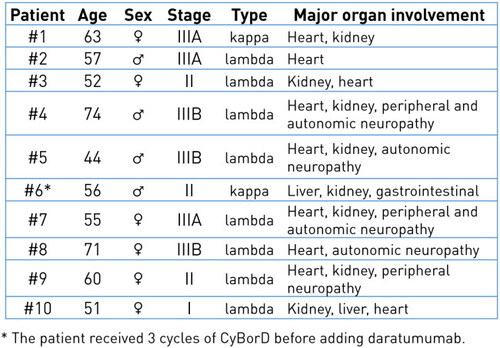
Figure 1. Kaplan–Meier estimates of overall survival (OS) stratified by ATTR amyloidosis subtype (panel A) and time period of diagnosis for each ATTR amyloidosis subtype (panels B–D).
Notes: Follow-up began at the date of ATTR amyloidosis diagnosis. Patients were censored at end of follow-up (assessed 11/2022) or last known clinical visit or contact date. Comparisons to reference groups (ref.) were computed by log-rank tests.
Abbreviations: OS, overall survival; CI, confidence interval; NR, not reached.
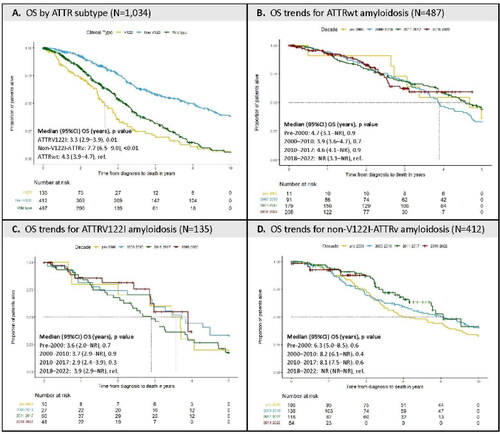
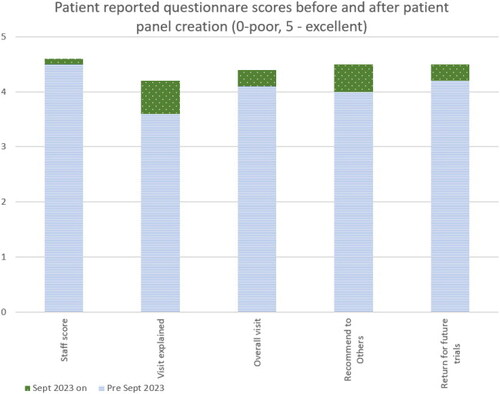
Table 1. Indication for Salivary Gland Biopsy/Resection by Amyloid Type (N = 34).
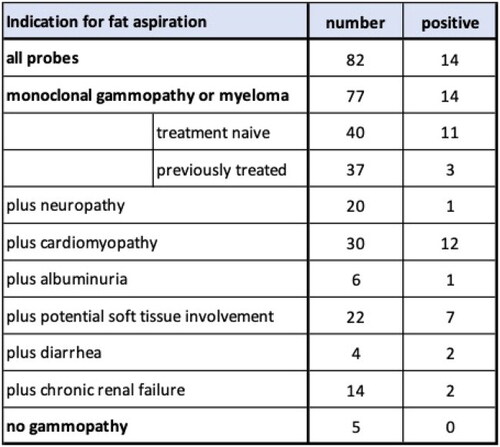
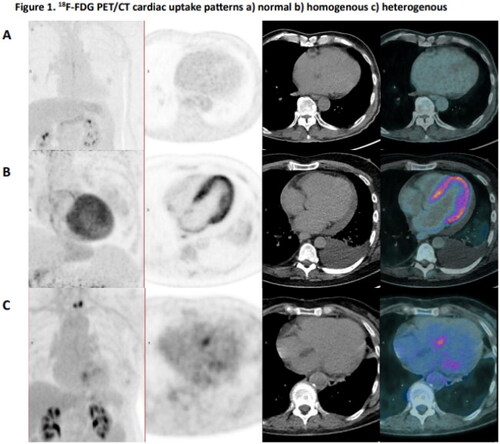
Table 1. Multivariable model predicting overall survival.
Table 1. Baseline clinical characteristics.
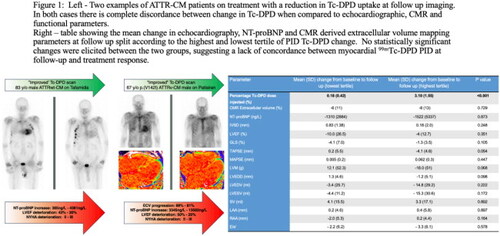
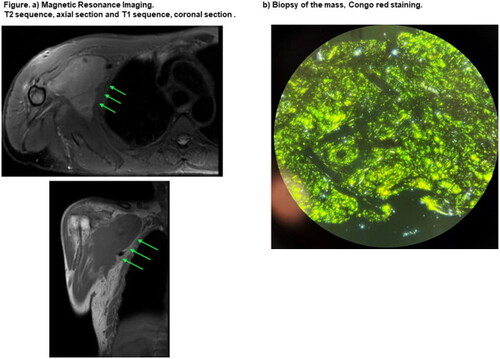
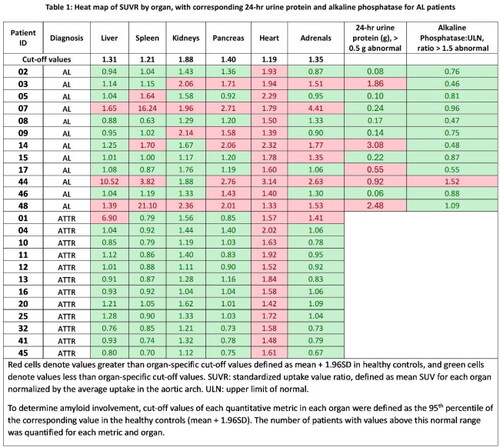
Figure 1. (A) Hematoxylin and eosin stain of core needle biopsy of subcutaneous soft tissue mass (4×). (B) Polarized Congo red stain of tissue from core needle biopsy of subcutaneous soft tissue mass (10×).
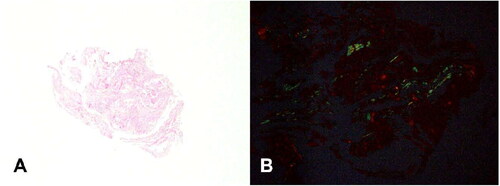
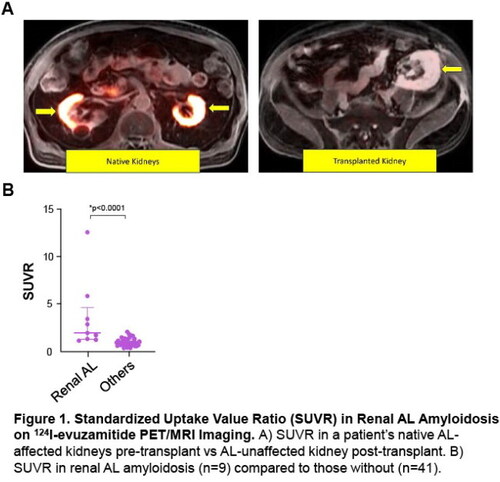
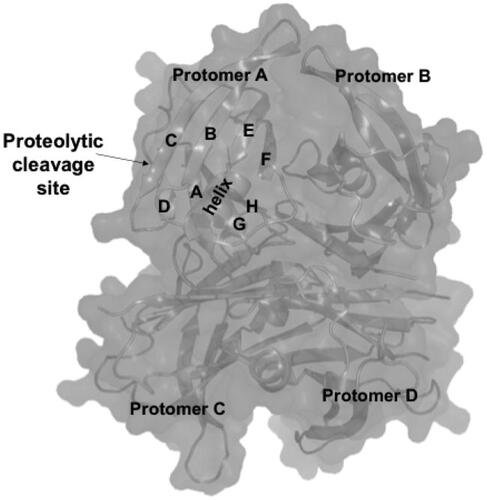
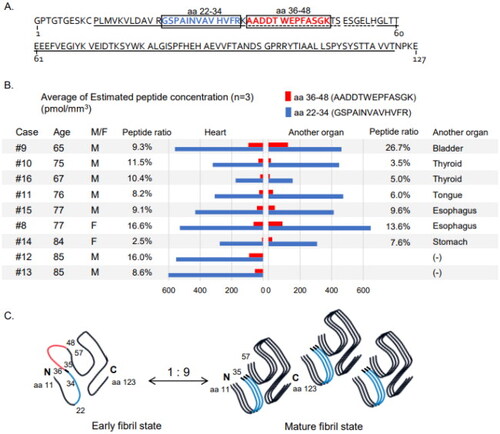
Table 1. Univariate and multivariate logistic regression models.
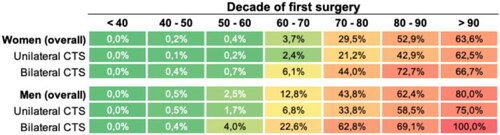
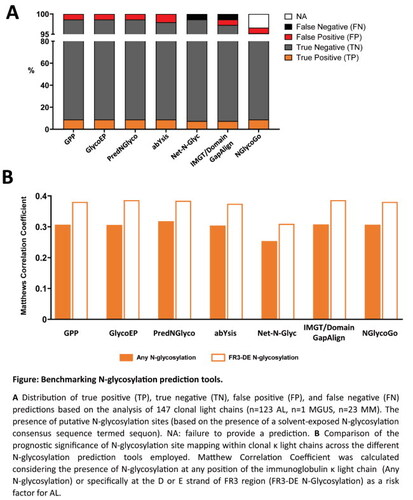
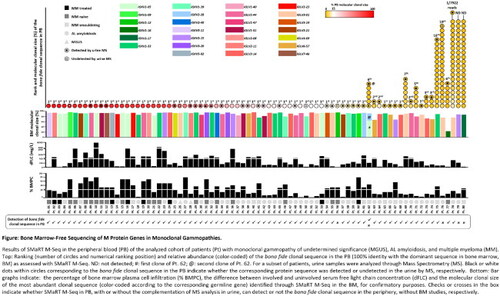
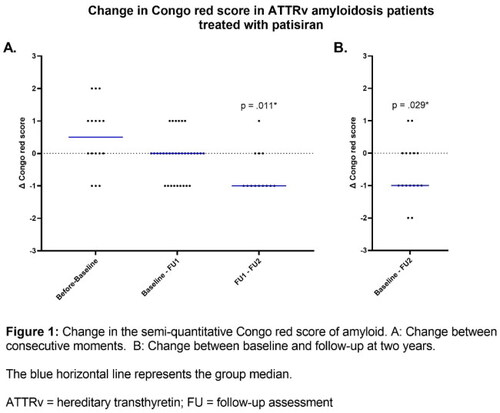
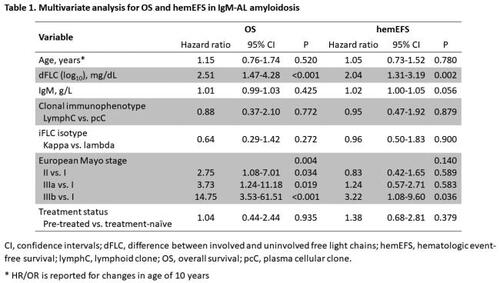
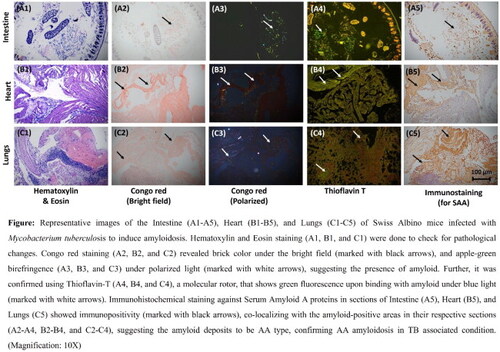
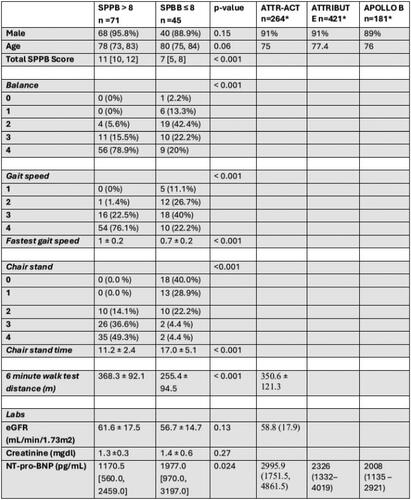
Table 1. Baseline clinical and instrumental features of the study population.
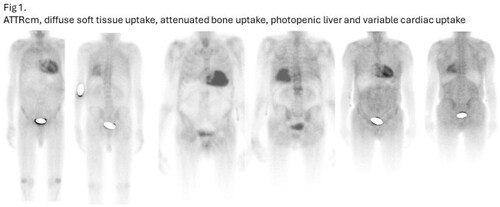
Table 1. General characteristics of patients treated with DRd and D-VCd, respectively.
Table 1. Significant laboratory and imaging findings at the time of diagnosis of lymphoplasmacytic lymphoma.
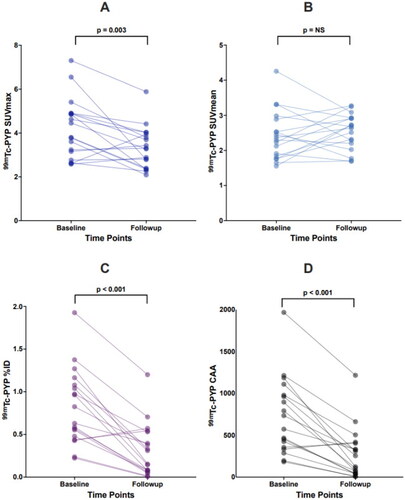
Table 1. General characteristics of symptomatic and carriers diagnosed with hATTR Ile107Val and Glu54Gln.
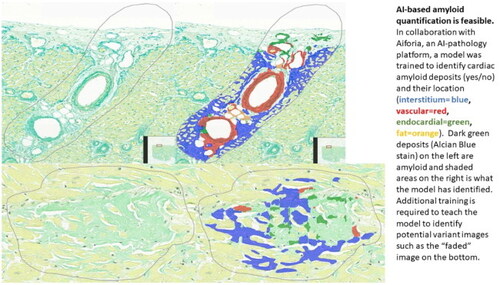
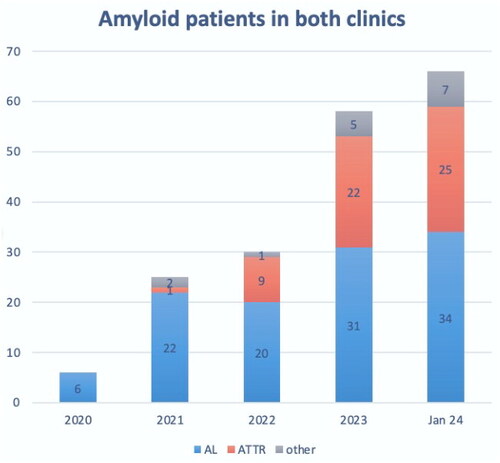
Table 1.
Table: Reported cases of de novo AL amyloidosis in kidney allograft
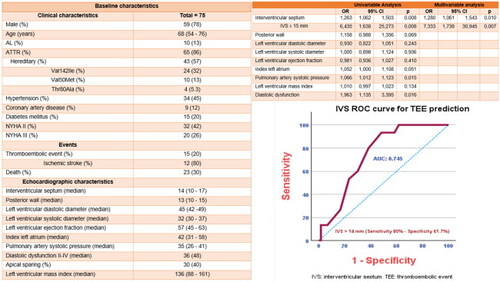
Table 1. Baseline clinical and instrumental features of the study population.
Table 1 Correlation between 124I-Evuzamitide uptake and direct and indirect markers of amyloid burden, quality of life, and functional status.
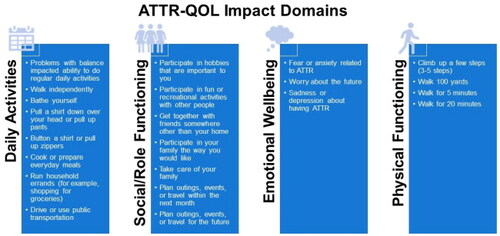
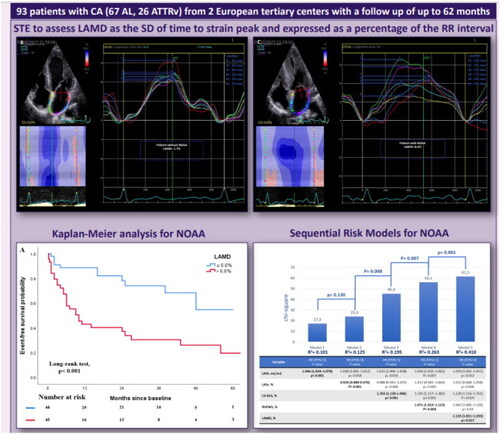
Table 1. Baseline characteristics of 874 endomyocardial biopsies at the UK NAC.
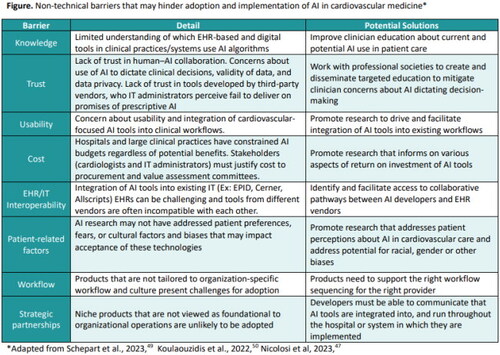
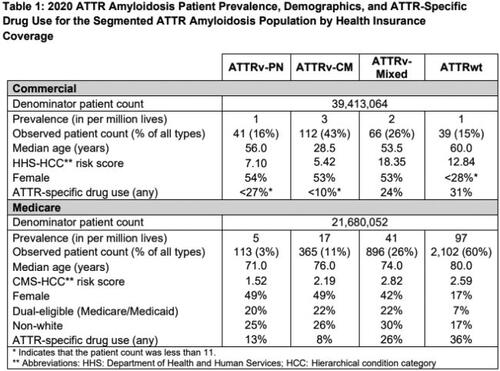
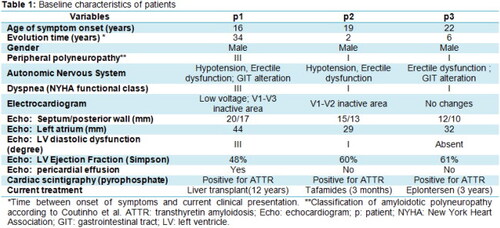
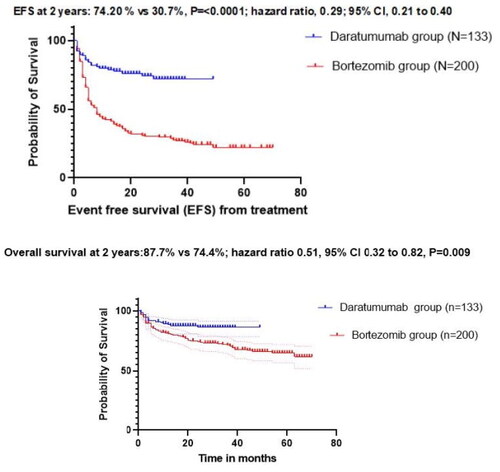
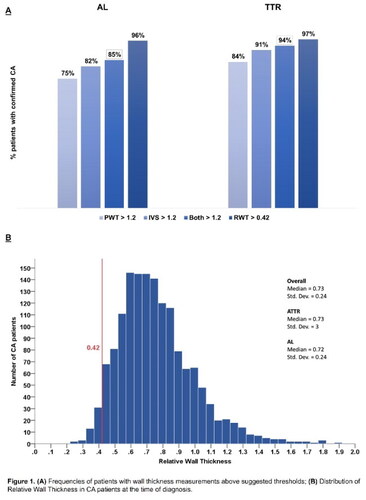
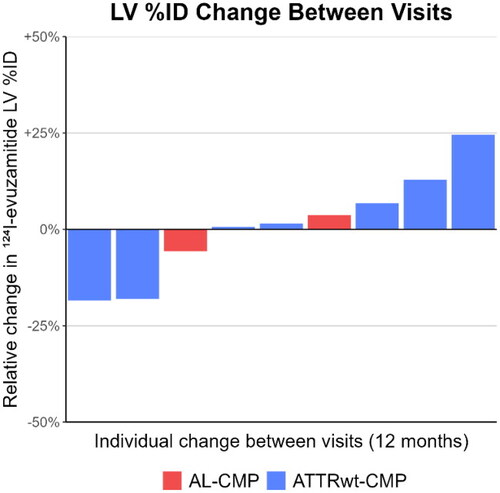
Table 1 Patients’ characteristics associated with the use of enhanced AI-based models to detect cardiac amyloidosis.