Figures & data
Figure 1 .#Illustration of the trial procedure in Experiment 1. Participants were presented with a word indicating whether they would get a new cue/target, or the previous cue and target were repeated. The cue signalling the target was indicated by the task-relevant colour as set for any particular block (here red, in other blocks it would be green). The other object in the cue display was to be ignored. After a 1000 ms delay the search display appeared. Participants were instructed to find the target and indicate whether there was an M or N printed inside (here N). The same cue/target combination was then repeated six times. Note that the features were repeated, not the positions. For illustrative purpose, the size of the stimuli is exaggerated in this and in the following figures. In reality, the cues were much smaller and positioned at 9 degrees eccentricity, so that the gap could not be distinguished when focusing on the centre. Thus, an eye movement had to be made at least once in order to do the task.
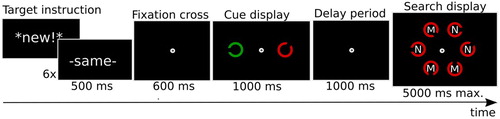
Figure 2. Main results of Experiment 1. (A) Search RTs for correct responses, (B) average proportion of first saccades towards target cues, (C) average duration of fixations on target cues and irrelevant cues, as a function of cue repetition, and (D) average saccade size as a function of cue repetition. Error bars represent the standard error of the mean (SEM) for within-subject variables (Cousineau, Citation2005; Morey, Citation2008).
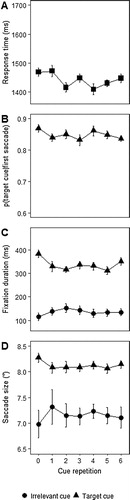
Table 1. Mean proportion of trials with a valid first saccade in Experiment 1 (standard deviation in parentheses).
Figure 3. Illustration of the trial sequence in Experiment 2. In the consistent colour condition, in which cues remained constant throughout a streak of six trials, after which they changed according to the next step on the colour wheel (illustrated on the top right). In this example the cue was yellow, and remained so for six trials, after which it would change to orange for a streak, then to red, and so on. In the variable colour condition, the cues changed every trial rather than streak, again in a predictable manner, following the same colour wheel. Here the cue started as yellow, was orange on the next trial, red, purple and blue on the next three, and ended as green on the final trial of the streak. The colour of the irrelevant cue was chosen to be always two steps back from the colour of the target cue in the wheel, so that relative similarity between target and irrelevant cues remained constant, and predictiveness per se provided no information. For illustrative purposes, the relevant cues are here all presented left from fixation. In reality, they were randomly presented left and right from trial to trial. Also, actual cues were much smaller, so that the gap could not be distinguished from the periphery when looking at the centre of the display.
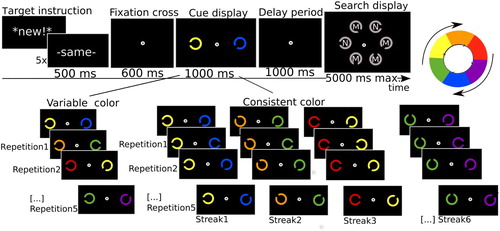
Figure 4. Main results of Experiment 2. (A) Search RTs for correct responses, (B) average proportion of saccades towards target cues, (C) average duration of fixations on target cues, as a function of repetition and condition (consistent versus variable colour cues), and (D) average saccade size towards the target cue. Error bars represent the standard error of the mean (SEM) for within-subject variables (Cousineau, Citation2005; Morey, Citation2008).
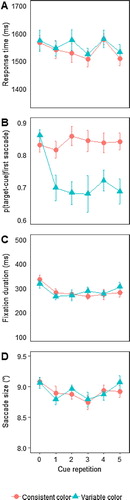
Table 2. Mean proportion of trials with a valid first saccade in Experiment 2 (standard deviation in parenthesis).
Figure 5. Illustration of the trial procedure, which in the informative cue condition was largely the same as in Experiment 1. In the uninformative cue condition only the first trial of each streak indicated the target gap, while in subsequent repetitions, cues were closed circles and thus did not have any information about the target gap.
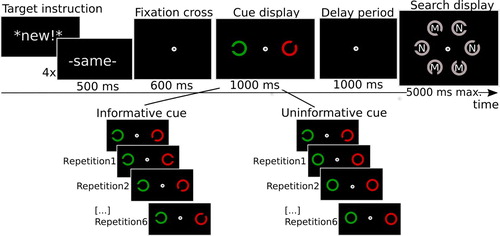
Figure 6. Results of Experiment 3 with (A) search RTs, (B) proportion of saccades towards target cues, (C) duration of fixations on target cues, and (D) average saccade size towards target cues. Error bars represent the standard error of the mean (SEM) for within-subject variables (Cousineau, Citation2005; Morey, Citation2008).
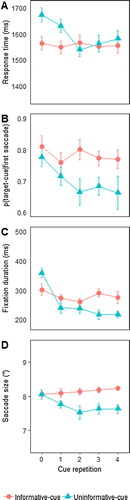
Table 3. Mean proportion of trials with a valid first saccade in Experiment 3 (standard deviation in parentheses).
Figure 7. Illustration of the trial sequence in Experiment 4. In the picture cue condition, observers received a pictorial cue as per Experiment 1. In the symbol cue condition, the number within the relevant cue indicated the position of the gap through its correspondence with standard clock positions. Here the relevant cue colour would be red, and hence participants would search for a C with the gap on the right (response = “N”).
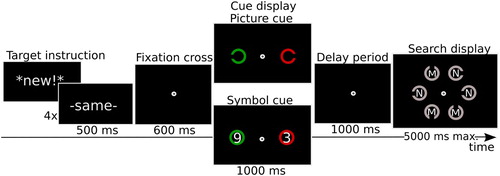
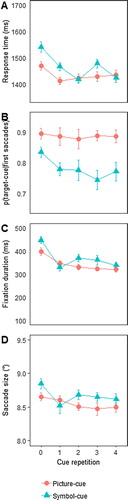
Figure 8. Results of Experiment 4, with (A) average search RTs, (B) average proportion of saccades towards target cues, (C) average duration of fixations on target cues, and (D) average saccade size towards the target cue. Error bars represent the standard error of the mean (SEM) for within-subject variables (Cousineau, Citation2005; Morey, Citation2008).