Figures & data
Figure 1. WM model relying on rapid neural plasticity to form object memories can utilize pattern completion and mutual inhibition to implement cued recall and visual search. (A) Depiction of the model’s architecture. For the purpose of visual search simulations, the three dimensions within the feature layer were designated to correspond to three searched locations and each unit within a dimension to represent a different colour (as occurs in the primary visual cortex). During memory encoding, the stimulus activates correspondingly tuned units in the feature-selective neurons (posterior cortex). The activation drives activity in the conjunction layer (anterior cortex) where, via mutual inhibition, the conjunctive units compete to encode the combination of active features. The winning conjunctive unit then mutually activates the feature units, and this recurrent activation encodes the information into the synapses via rapid Hebbian plasticity. (B) The same mechanism can be utilized to encode a visual search template into WM. In this case, the association between template colour at all locations is encoded into a conjunction unit. The conjunction unit can be driven by visual inputs to provide recurrent amplification of that colour within the network. (C) The resulting bias within the network guides the activation from the features within the visual search display enhancing the target feature. A successful activation of the template conjunction unit triggers pattern completion that leads to selection of the target and inhibition of the distractors via mutual inhibition. (D) The relative position of feature units within the feature layer can be rearranged to reveal their spatial arrangement within a feature map.
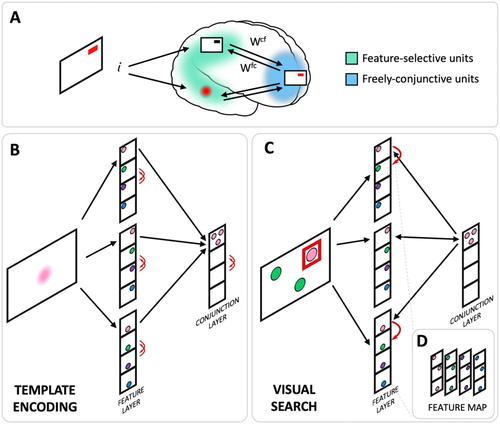
Figure 2. Simulation 1: Visual search set size effect, distractor repetition and distractor similarity. (A) Time course of feature activity traces of a representative trial for the three experimental conditions. Each trial started with a 200 ts inhibition period followed by encoding of the template (120 ts). Following a delay period of 300 ts, visual search display was presented for 120 ts. Responses were recorded over the following response period of 400 ts. A variable number of distractor colours were presented at the two non-target locations (zero- top, one- middle, two- bottom). For visualization, a small vertical shift was added to the feature neuron firing rate traces. (B) The model reproduced the visual search set size effect. Increasing the number of items presented during visual search led to an increase in RTs (set size 1 = zero distractors). Data were reproduced from Wolfe (Citation1994). (C) Search was more efficient for homogeneous compared to heterogeneous distractors. Data were reproduced from Kong et al. (Citation2016). (D) The model, however, did not replicate the distractor repetition effect. In the 1TGT-1DIST condition, repetition in the distractor’s location or its location and colour in addition to the target location did not improve RTs compared to trials in which the distractor changed its location (i.e., zero distractor repeated). Data were reproduced from Kristjánsson and Driver (Citation2008).
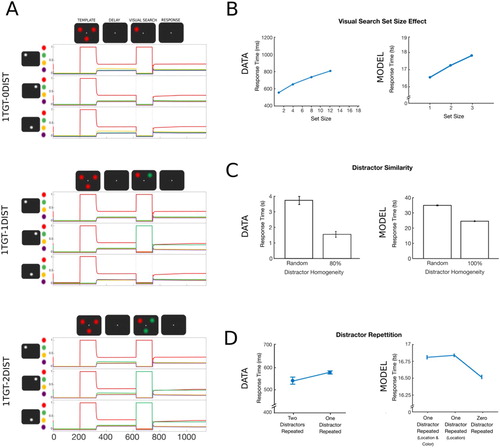
Figure 3. Simulation 2: Visual search target repetition effect. (A) Time course of feature activity traces of a representative trial for the two experimental conditions. Each trial started with a 200 ts inhibition period followed by the encoding of the first template (120 ts). Following a delay period of 300 ts, the first visual search display was presented for 120 ts. This sequence was repeated for the second template (template repeat- top, template switch- bottom). Responses to the second visual search were recorded over the response period of 400 ts. Two distractor colours were always presented at the two non-target locations. For visualization a small vertical separation has been added to the feature firing rate traces. (B) Target repetition leads to improved performance compared to template switch. Both the number of errors (top) and RTs (bottom) were higher on trial pairs in which the template switched its colour compared to trials pairs in which the template stayed the same. Data were reproduced from Maljkovic and Nakayama (Citation1994). (C) Location priming in target repetition and target switch trials. Repetition of target location in addition to its colour resulted in higher accuracy, but target selection was delayed compared to when the target was presented at a different location. In contrast, when target colour was switched from one trial to another, the model produced more errors, however when the correct target colour was selected, it was selected faster.
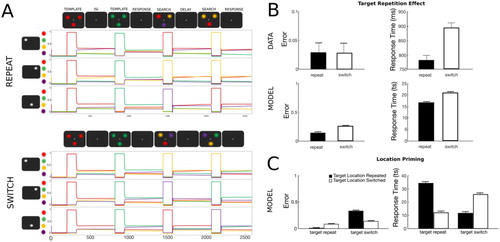
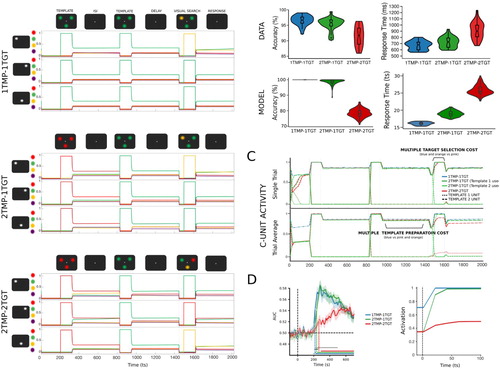
Figure 4. Simulation 3: Multiple template preparation cost and multiple template-based selection cost. (A) Time course of feature activity traces of a representative trial for the three experimental conditions. Each trial started with a 200 ts inhibition period followed by a serial encoding of one or two templates (120 ts; ISI 500 ts). Following a delay period of 300 ts, all features were inhibited (50 ts) before and after (5 ts) visual search display was presented for 120 ts. A distractor colour was always presented at a non-target location. For visualization a small vertical separation has been added to the feature unit activity traces. (B) Multiple template preparation cost: the activation of a second template in preparation for search resulted in reduced accuracy: 1TMP-1TGT (blue) vs 2TMP-1TGT (green). Accuracy was worsened even more when both templates had to be engaged during search: 2TMP-1TGT (green) vs 2TMP-2TGT (red). Decrements in accuracy were accompanied by increases in RTs. The violin plots represent the distribution of accuracy (A) and RTs (B) derived from empirical data (top) and simulated data (bottom). The boxes represent the median (central horizontal bar) and quartile range (upper and lower horizontal bar). The vertical lines represent the minimum and maximum (lower and upper quartile + 1.5 * interquartile range, respectively). Outliers are depicted as single unfilled dots. (C) Single unit and average conjunction unit activity representing the templates for the different experimental conditions. Multiple template preparation cost: During preparation for visual search, there was a small cost associated with preparing two templates each encoded in a separate unit compared to only preparing one template (blue vs green). When currently active template had to be switched to perform search, as was the case when the target matched the first encoded template, there was a slight delay in the template unit’s activation during search. Multiple target selection cost: There was a more significant cost associated with an increased number of templates (and conjunction units) engaged to guide visual search. In the 2TMP-2TGT condition (red), the search-guiding conjunction unit took longer to reach its peak activation due to competition with other conjunction units. The average trace suggests concurrent and weaker activation of both templates (red dashed and dotted lines). However, the examination of single unit traces showed activation of only one of the two conjunction units (different unit on different trials). (D) Similarly to empirically recorded neural data, average activation traces of template conjunction units showed a smaller template preparation cost (1TMP-1TGT vs 2TMP-1TGT). However, the average activation of the templates’ neural representations in the 2TMP-2TGT condition was significantly delayed corresponding to the added cost of target selection based on two different templates.