Figures & data
Figure 1. Illustration of the experimental set-up. The model (right) was presented to the participants (left) through a voltage sensitive LC window.
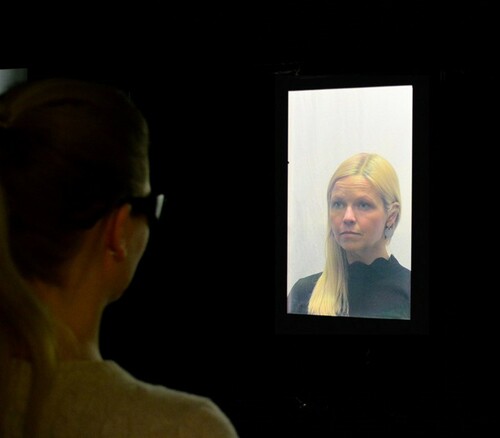
Figure 2. Individual zygomatic region electromyographic (EMG) responses and their means (and 95% CI) as a function of the model’s and participant’s gaze direction and the colour of the lenses. Abbreviations: M = model; P = participant; d = direct gaze; a = averted gaze. (The data were visualized by an R Shiny app by Postma & Goedhart, Citation2019).
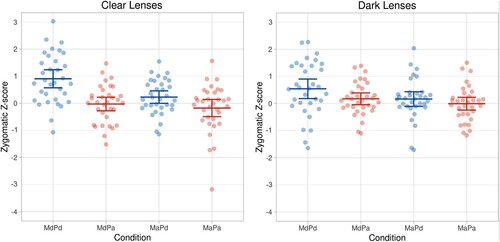
Figure 3. Individual periocular region electromyographic (EMG) responses and their means (and 95% CI) as a function of the model’s and participant’s gaze direction and the colour of the lenses. Abbreviations: M = model; P = participant; d = direct gaze; a = averted gaze. (The data were visualized by an R Shiny app by Postma & Goedhart, Citation2019).
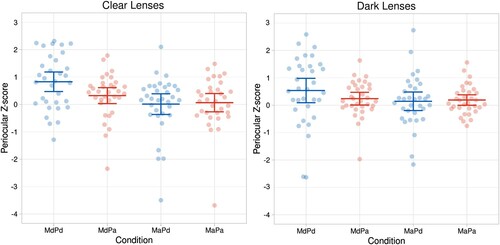
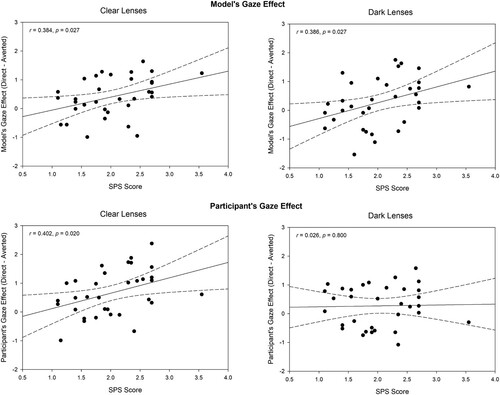
Figure 4. The association between the participants’ scores on the social anxiety scale and the gaze effect (Δ direct gaze – averted gaze) for the model’s gaze and participant’s own gaze when the participants were wearing glasses with clear and dark lenses. Dotted lines denote 95% CI.