
Figures & data
Figure 1. Participant’s point-of-view during the dyadic interaction, with gaze overlaid.
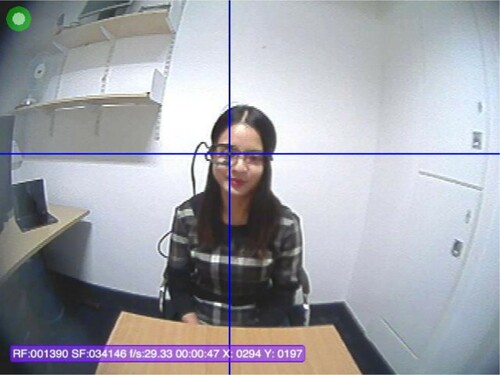
Figure 2. Bounding box surrounding the face region, with features identified for region-of-interest tracking.
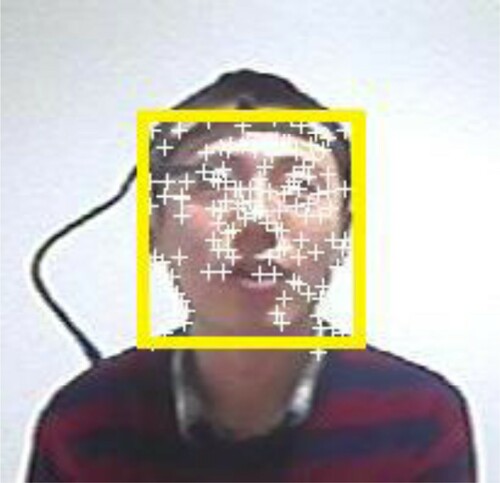
Figure 3. Proportional face looking time (range 0 to 1) of East Asian and Western Caucasian participants during the introduction and storytelling task, both when listening and when speaking (see also for values). Gaze times are proportional to approx. 30-second recording time per condition (task/speech).
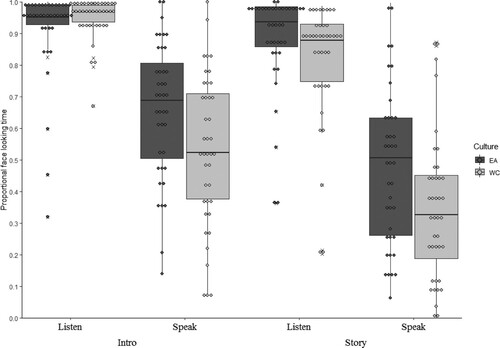
Table 1. Medians and interquartile ranges for face orienting (in %).
Figure 4. Proportional mutual gaze time (range 0 to 1) for East Asian and Western Caucasian participants during the introduction and the storytelling task (see also ). Gaze times are proportional to approx. 1-minute recording time per task.
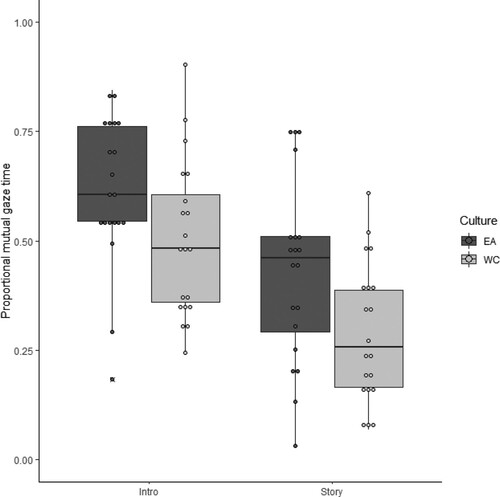
Table 2. Means and standard deviations for mutual face dwell time (in %).
Figure 5. Decile medians of distributions for mutual gaze instances for the introduction (left) and storytelling game (right). Lines represents 95% CI.
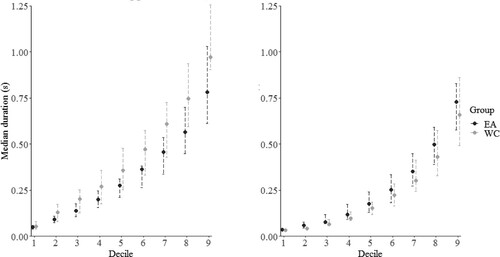
Figure 6. Decile medians of distributions for mutual gaze instances for the introduction (left) and storytelling game (right), when blinks are not considered as event offsets. Lines represents 95% CI.
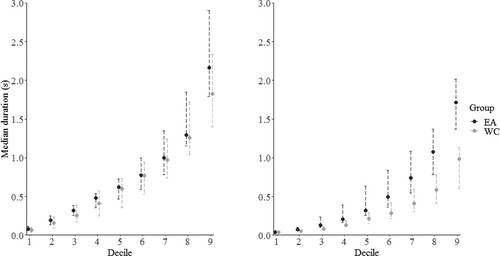
Table 3. Spearman’s correlation coefficients and associated p-values for the relationship between AQ scores and face looking time during speaking and listening periods.
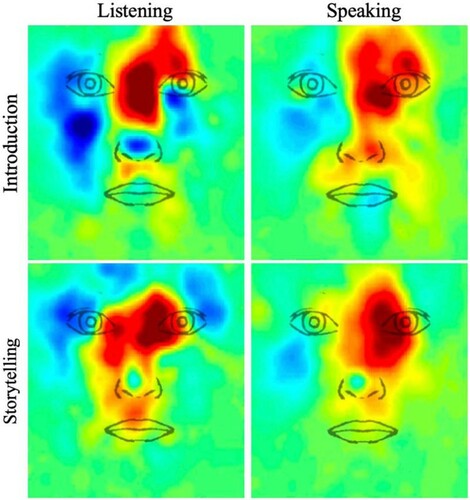
Figure 7. Descriptive heat maps visualizing cultural differences in face scanning during periods of listening (left) and speaking (right) for the introduction task and storytelling game. Red and blue colours depict regions that East Asians and Western Caucasians scanned more, respectively.
Supplemental Material
Download PDF (281.4 KB)Data availability statement
The raw datasets (scene videos) are not publicly available since they disclose personally identifiable information. However, all processed data analyzed for this study are made available in anonymised form with DOI 10.17605/OSF.IO/A7U6D (https://osf.io/a7u6d/).