Figures & data
Figure 1 . Schematic view of target individuals (T1–T6) and video camera set up during stimuli creation.
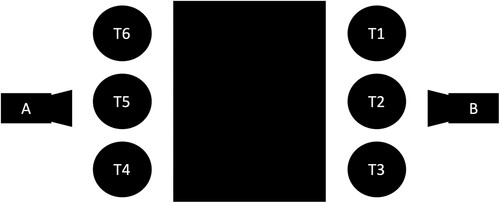
Figure 2. A visualisation of the four video conditions (Control, Silent, Freeze Frame and Blank) shown to third-party participants.
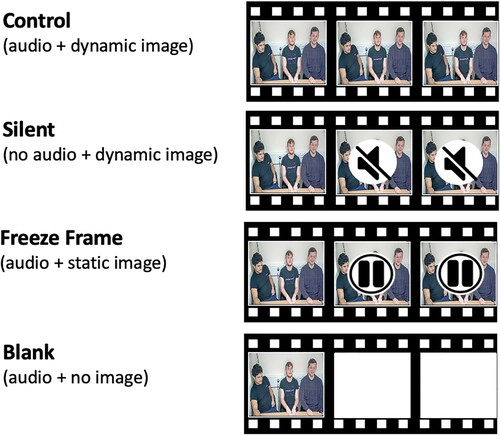
Table 1. Average percentage time spent in each of the gaze locations for the live behaviour and the third-party viewing of the Control condition.
Figure 3. Time series representing the gaze location of each eyetracked participant (P1–P8, third-party participants) and each interacting target (T4–T6, live interaction) as they looked at the targets of interest (T1–T3). Line charts on the left show the proportion of observers gazing at each location (data smoothed over time). Coloured bars on the right show the target being looked at by each observer. In each case, time is on the x-axis (clip duration = 39,000 ms). Within this example there is an average of 88% agreement between live and third party (average κ = .76 with all pairings p < .001).
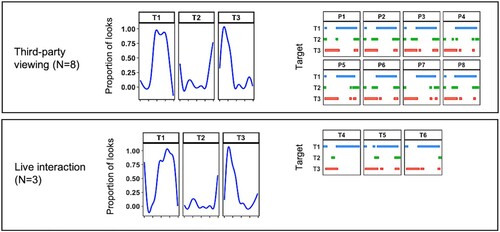
Figure 4. An example video frame, with ROIs selecting each of the three targets.
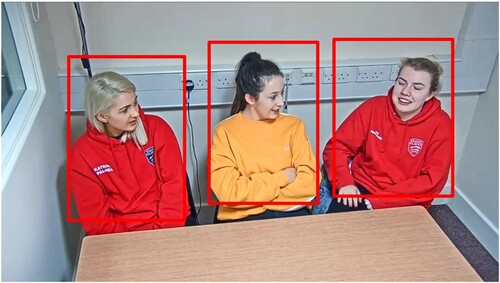
Table 2. Overall percentage of fixations on targets, post clip manipulation (average taken from 37 participants).
Figure 5. The overall percentage of fixations on the targets’ eyes, mouth and “elsewhere” (sum per condition = 100%), averaged across the participants. Error bars show standard error.
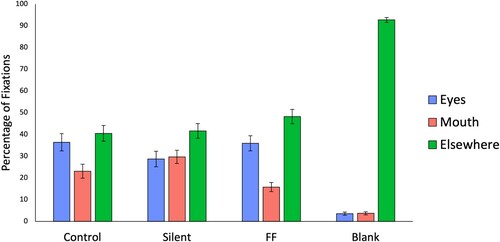
Figure 6. Percentage of fixations on target speakers for each condition (note “other targets” refers to the two other non-speaking targets grouped together). Error bars show standard error.
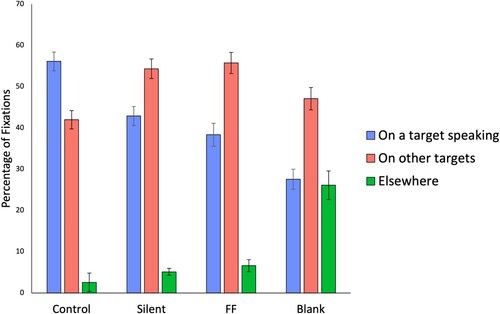
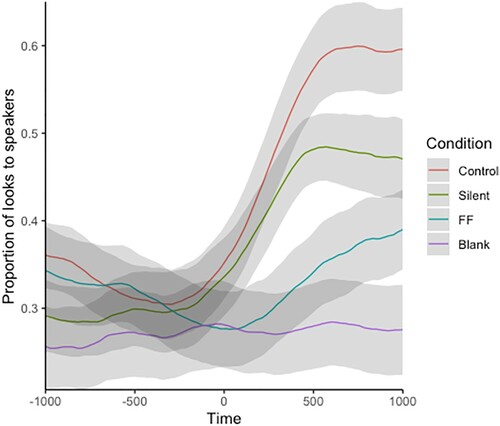
Figure 7. Probability of fixation being on the speaker, relative to when they started speaking. Lines show the smoothed, average proportion of fixations at this time on the speaker, in 10 ms bins (with 95% CI). A time of 0 indicates the time at which a speaker began speaking. FF: freeze frame condition.