Figures & data
Figure 1. Depiction of the Adaptive Choice Visual Search (ACVS) task (Irons & Leber, Citation2018, Experiment 2).
Top: stimulus from a sample trial, in which the subset of blue squares contains fewer items than the subset of red squares. Searching the smaller subset – blue, in this example – is considered the “optimal” choice, as it yields substantially faster performance. Bottom: Sequence of successive trials, showing that the colour of the smaller subset varies unpredictably, in randomized run lengths of 1–6. Figure reproduced from Irons and Leber (Citation2020).
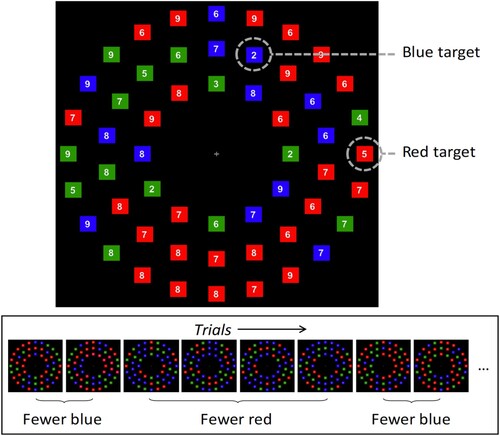
Table 1. ACVS descriptive statistics.
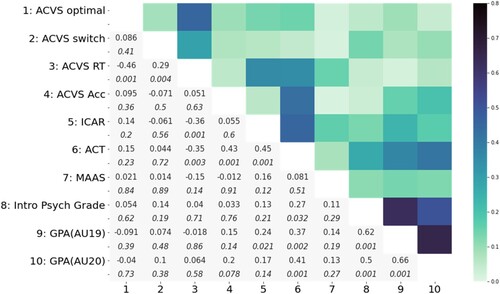
Figure 2. Correlation matrix: ACVS and survey metrics.
Note: Complete correlation matrix of comparisons of the ACVS and survey metrics. Pearson’s r and uncorrected p-values (denoted in italics) are shown below the diagonal. Graphical depiction of Pearson’s r coefficients, in absolute values, above the diagonal. Note that Intro Psych Grade, GPA(AU19), and GPA(AU20) are not independent, as they are calculated based on some degree of shared data.