
Figures & data
Figure 1. Target Stimuli. Note. An illustration of all target stimuli from Experiment 1 and 2.
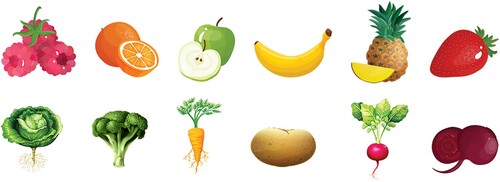
Figure 2. The Prime and Probe Phases Note. The prime phase included a single presentation of a critical verbal action-effect sentence without any deadline. After the prime phase, participants performed a visual search task (96 trials). During the probe phase, the participants’ task was to find either a fruit or a vegetable and press the “A” or “L” key, respectively. In one-third of the trials, the target stimulus was an apple (priming stimulus from the prime phase). The location of all figures changed randomly in each trial, and there was only one target stimulus among the distractors.
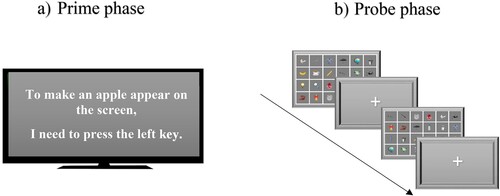
Table 1. Descriptive Statistics of the Response Time Test Phase and Response Errors.
Figure 3. An Illustration of Mixed-Models Analysis Note. The plot illustrates the results from the linear mixed model (A) and generalized linear mixed model (B), with confidence intervals derived from these regression analyses. The mean values on both graphs represent marginally estimated means.
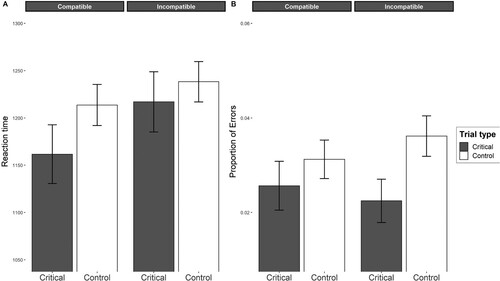
Table 2. Descriptive Statistics of the Response Time Test Phase and Response Errors.
Figure 4. An Illustration of Mixed-Models Analysis Note. The plot illustrates the results from the linear mixed model (A) and generalized linear mixed model (B), with confidence intervals derived from these models. The mean values on both graphs represent marginally estimated means.
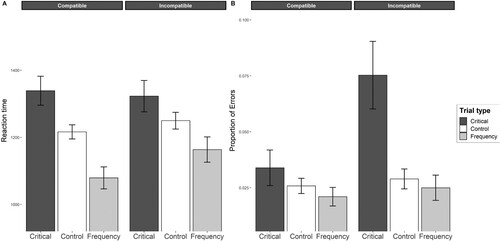
Table A1. The Results from the Reaction Time Analysis of the Fixed Effects in Experiment 1.
Table A2. Results from the Response Error Analysis of the Fixed Effects in Experiment 1.
Table A3. Results from the Reaction Time Analysis of the Fixed Effects in Experiment 2.
Table A4. Results from the Response Error Analysis of the Fixed Effects in Experiment 2.