
Figures & data
Figure 1 . Example stimuli for the blank (top), array (middle) and scene (bottom) conditions, with insets in the blank display illustrating frontal (F) and profile (P) face targets.
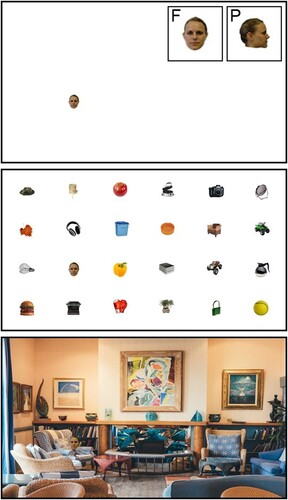
Table 1 . Mean RTs (ms), Accuracy (%) and Inverse Efficiency Scores (IES) for Frontal (F) and Profile (P) Faces in the Blank, Array and Scene Conditions in Experiment 1. Parentheses Show the Standard Deviation of the Mean.
Table 2 . Mean RTs (ms), Accuracy (%) and IES for Upright (U) and Rotated (R) Faces in the Blank, Array and Scene Conditions in Experiment 2. Parentheses Show the Standard Deviation of the Mean.
Table 3 . Mean RTs (ms), Accuracy (%) and IES for Upright (U) and Inverted (I) Faces in the Blank, Array and Scene Conditions in Experiment 3. Parentheses Show the Standard Deviation of the Mean.
Figure 2 . Illustration of the stimuli for Experiment 4, showing a face that is intact and upright (left), with internal-upright features (middle), and with external-upright features (right).
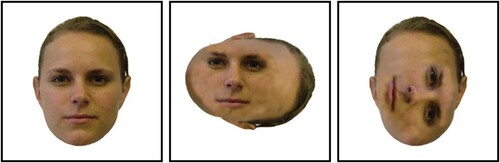
Table 4 . Mean RTs (ms), Accuracy (%) and IES for Upright (U), External-upright (E), and Internal-upright Faces (I) in the Blank, Array and Scene Conditions in Experiment 4. Parentheses Show the Standard Deviation of the Mean.
Figure 3 . Illustration of the stimuli for Experiment 5, showing an upright face on an original, unfiltered scene (top left), and scenes of high (top right), medium (bottom left) and low complexity (bottom right).
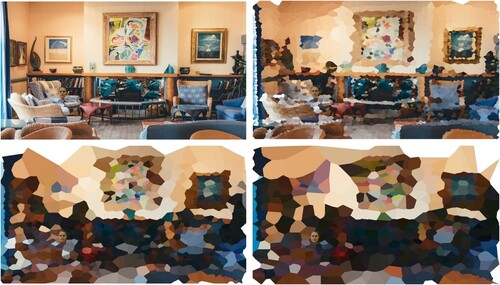
Table 5 . Mean RTs (ms), Accuracy (%) and IES for Upright (U) and Inverted (I) Faces at Original, High, Medium and Low Voronoi scenes in Experiment 5. Parentheses Show the Standard Deviation of the Mean.