Figures & data
Figure 1 Concentration of H2O2 in plasma of patients with depression (n = 15), hypertension (n = 20), and hypertension with comorbid depression (n = 16) compared with controls (n = 19); *P < 0.001.
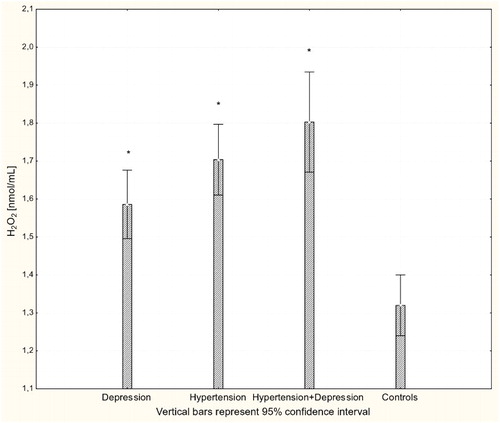
Figure 2 Concentration of MDA in erythrocytes of patients with depression (n = 15), hypertension (n = 20), and hypertension with comorbid depression (n = 16) compared with controls (n = 19); *P < 0.001.
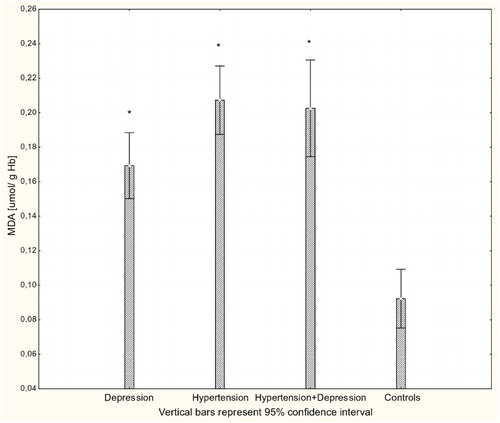
Figure 3 Concentration of GSH in whole blood of patients with depression (n = 15), hypertension (n = 20), and hypertension with comorbid depression (n = 16) compared with controls (n = 19); *P < 0.01.
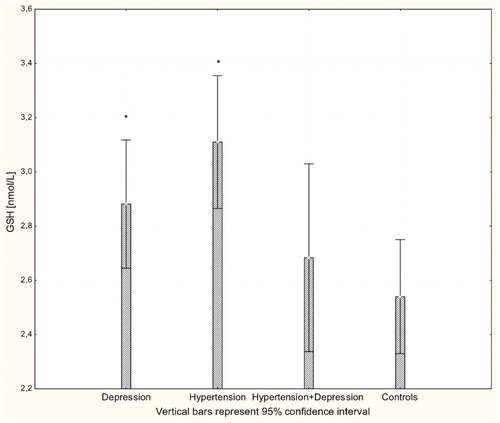
Figure 4 Activity of GR in erythrocytes of patients with depression (n = 15), hypertension (n = 20), and hypertension with comorbid depression (n = 16) compared with controls (n = 19); *P < 0.01.
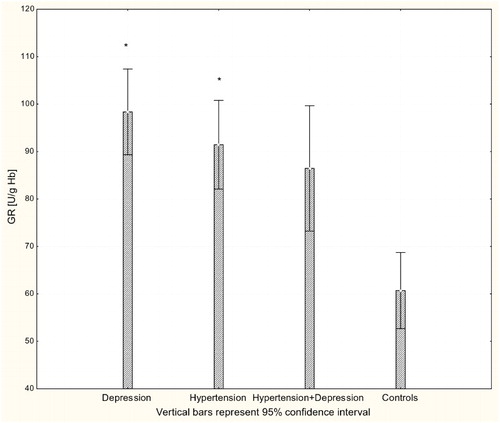
Figure 5 Activity of GPx-1 in erythrocytes of patients with depression (n = 15), hypertension (n = 20), and hypertension with comorbid depression (n = 16) compared with controls (n = 19); *P < 0.001.
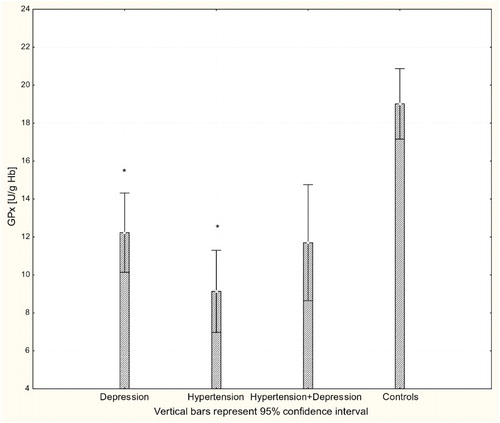
Figure 6 Activity of SOD-1 in erythrocytes of patients with depression (n = 15), hypertension (n = 20), and hypertension with comorbid depression (n = 16) compared with controls (n = 19); *P < 0.001.
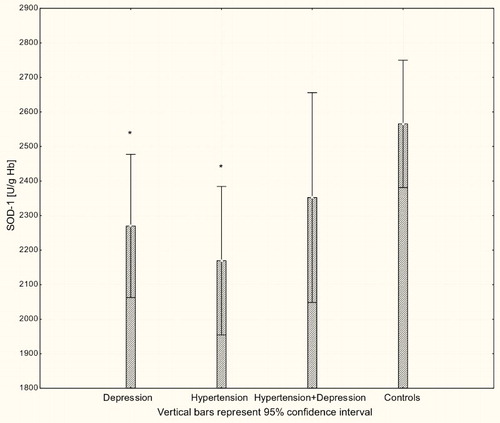
Figure 7 Concentration of HO-1 in serum of patients with depression (n = 15), hypertension (n = 20) and hypertension with comorbid depression (n = 16) compared with controls (n = 19); *P < 0.005.
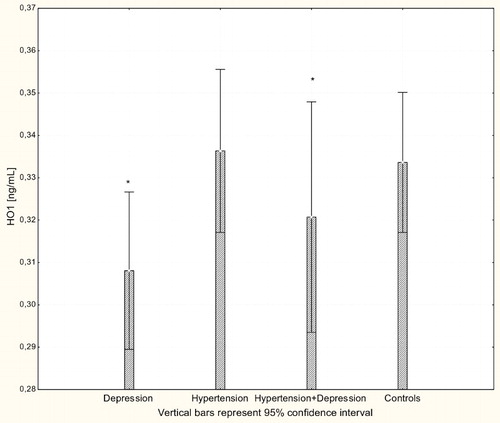
Figure 8 Scatter plot of BDI against HO-1 in study population. BDI – Beck Depression Inventory; HO-1 – heme oxygenase.