Publication Cover
Redox Report
Communications in Free Radical Research
Volume 21, 2016 - Issue 5
528
Views
4
CrossRef citations to date
0
Altmetric
Original Articles

Redox imbalance in peripheral blood of type 1 myotonic dystrophy patients

, , , , , & show all

Figures & data

Figure 1. Antioxidant enzyme activities in erythrocytes from DM1 patients (n = 30) and HCs (n = 15). Results are expressed as mean ± SE and compared by t-test. ***P < 0.001, **P < 0.01.
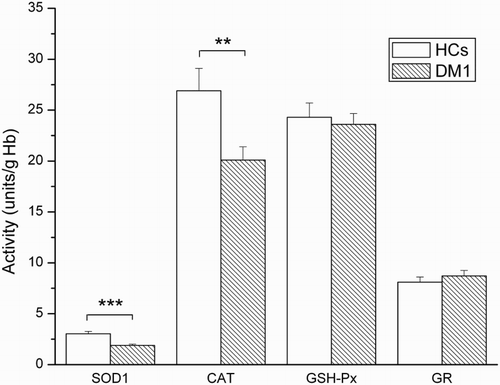
Figure 1. Antioxidant enzyme activities in erythrocytes from DM1 patients (n = 30) and HCs (n = 15). Results are expressed as mean ± SE and compared by t-test. ***P < 0.001, **P < 0.01.

Figure 2. Native PAGE gel stained for SOD1 enzyme activity with NBT. Lanes, from left to right: HCs; HCs + H2O2; DM1 and DM1 + H2O2. Histogram presents quantitative analysis of SOD activity. Graphs represent % from SOD activity HCs taken as 100% (±SE). Statistical analysis showed a more pronounced reduction in activity after H2O2 treatment of DM1 SOD compared with to HC SOD (***P < 0.001; n = 7, vs. *P < 0.05; n = 5). Note the difference between samples with respect to relative band intensity (in-gel SOD1 activity). For details, see ‘Methods’ section.
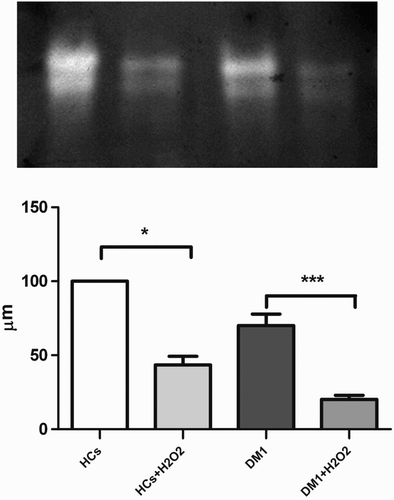
Figure 2. Native PAGE gel stained for SOD1 enzyme activity with NBT. Lanes, from left to right: HCs; HCs + H2O2; DM1 and DM1 + H2O2. Histogram presents quantitative analysis of SOD activity. Graphs represent % from SOD activity HCs taken as 100% (±SE). Statistical analysis showed a more pronounced reduction in activity after H2O2 treatment of DM1 SOD compared with to HC SOD (***P < 0.001; n = 7, vs. *P < 0.05; n = 5). Note the difference between samples with respect to relative band intensity (in-gel SOD1 activity). For details, see ‘Methods’ section.

Table 1 The activity of antioxidant enzymes in DM1 patients with different severity of muscle impairment

Table 2 Comparison of antioxidant defense in HCs and DM1 patients with normal and increased CK values

Table 3 Correlation analysis of different clinical parameters with activity of antioxidant enzymes in DM1 patients (n = 30)

Figure 3. Canonical discriminant analysis of the activity of antioxidant enzymes in different forms of DM1 according to (A) different severity of MIRS and (B) CK levels, presented as two-dimensional canonical space. Canonical analysis significantly separated DM1 patients with MIRS III and IV stages from HCs and the other two stages (P < 0.001). DM1 patients were significantly separated from HCs regardless if CK levels were increased (P < 0.001).
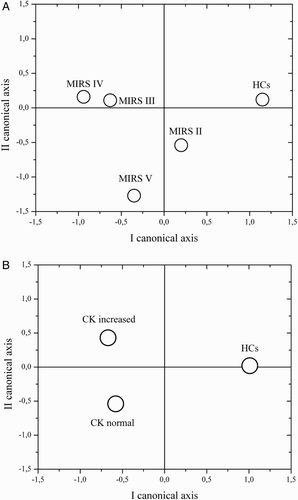
Figure 3. Canonical discriminant analysis of the activity of antioxidant enzymes in different forms of DM1 according to (A) different severity of MIRS and (B) CK levels, presented as two-dimensional canonical space. Canonical analysis significantly separated DM1 patients with MIRS III and IV stages from HCs and the other two stages (P < 0.001). DM1 patients were significantly separated from HCs regardless if CK levels were increased (P < 0.001).

Reprints and Corporate Permissions

Please note: Selecting permissions does not provide access to the full text of the article, please see our help page How do I view content?

To request a reprint or corporate permissions for this article, please click on the relevant link below:

Academic Permissions

Please note: Selecting permissions does not provide access to the full text of the article, please see our help page How do I view content?

Obtain permissions instantly via Rightslink by clicking on the button below:

If you are unable to obtain permissions via Rightslink, please complete and submit this Permissions form. For more information, please visit our Permissions help page.