Figures & data
Figure 1 DPI treatment efficiently decreased ROS levels in a dose-dependent manner without affecting the growth of L. monocytogenes. (A) ROS level in L. monocytogenes decreased dose-dependently with DPI concentrations. ROS was measured by DCFH-DA, and fluorescence was determined to indicate the ROS level. The ROS level of 0 μM DPI-treated bacteria was set at 100%, and those of the other groups were divided by that of the 0 μM-treated group to normalize the data. One-way ANOVA was used to perform statistical analysis, *P < 0.05, **P < 0.01, ***P < 0.001. (B) CFU of L. monocytogenes was not altered when treated with DPI. CFU of each group was transformed to log CFU. C, MTT assays suggested no considerable changes in bacterial activity under DPI treatment. The absorbance data at 570 nm of each group were normalized with the same method used in (A) and (B).
Figure 2 NAC treatment decreased ROS level in L. monocytogenes without affecting bacterial growth. (A) ROS in L. monocytogenes decreased with decreasing NAC concentration. The ROS level of 0 mM NAC-treated bacteria was set at 100%, and those of the other groups were divided by that of the 0 mM-treated group to normalize the data. One-way ANOVA was used to perform statistical analysis, *P < 0.05. (B) CFU of L. monocytogenes was not altered when treated with NAC. CFU of each group was transformed to log CFU. (C) MTT assays suggested no considerable changes in bacterial activity under NAC treatment. The absorbance data at 570 nm of each group were normalized with same method used in (A) and (B).
Figure 3 Apoptosis ratio of glial cells increased upon invasion by DPI- and NAC-treated L. monocytogenes. (A) Flow cytometry data of U251 cells without L. monocytogenes invasion. X-axis refers to the annexin V-FITC, and the Y-axis refers to PI. Cell status is analyzed in four quadrants, and annexin V+/PI+ double-positive cells are presented in the upper-right quadrant. (B) Flow cytometry assay of U251 cells after invasion by EGDe. (C) Flow cytometry assay of U251 cells after invasion by DPI-treated EGDe. (D) Flow cytometry assay of U251 cells after invasion by NAC-treated EGDe. (E) Statistical analysis of cells in each quadrant of the cytometry assay. (F) Statistical data of annexin V+/PI+ positive cells. Student t-test was used for statistical analysis, *P < 0.05, **P < 0.01.
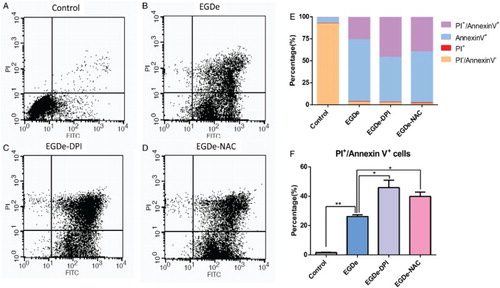
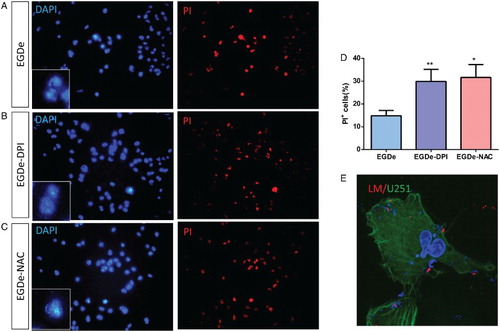
Figure 4 PI staining analysis of U251 cells after invasion by L. monocytogenes. (A) DAPI and PI staining of U251 cells after invasion by EGDe without treatment. (B) DAPI and PI staining of U251 cells after invasion by 2.0 μM DPI-treated EGDe. (C) DAPI and PI staining of U251 cells after invasion by 1.0 mM DPI-treated EGDe. (D) Statistical analysis of apoptotic cells in (A–C). Apoptosis ratio was calculated by dividing the number of PI-positive cells with that of DAPI-positive cells. Student t-test was used for statistical analysis, *P < 0.05, **P < 0.01. (E) Immunostaining of L. monocytogenes. As no permeation was taken, only extracellular bacteria can be labeled (Red), intracellular bacteria and cell nucleus were labeled with DAPI (Blue), U251 cells were labeled with Acti-stain 488(Green).