Figures & data
Figure 1 The placement of electrodes and alignment of their signal. (A) Arrows indicate which pair of electrodes was used for measurement in the majority of experiments. Four pairs were used for multiple channel monitoring. (B) Alignment of the signal for the experiments with multiple channel vmonitoring.
Figure 2 Agreement between oscillations in redox potential and breathing. Fragment of the oscillations for two breathing frequencies, ∼7.5 Hz (A) and 5 Hz (B). The scale is preserved – faster breathing resulted in visibly lower amplitude of oscillations. (C) The wavelet analysis of the measured signal. The change in period of the observed oscillations due to change in the breathing frequency is clearly visible. Heartbeat oscillations are seen as a wide band in the period range of 0.3–1. Slow oscillations are visible, albeit not statistically significant, in this measured window.
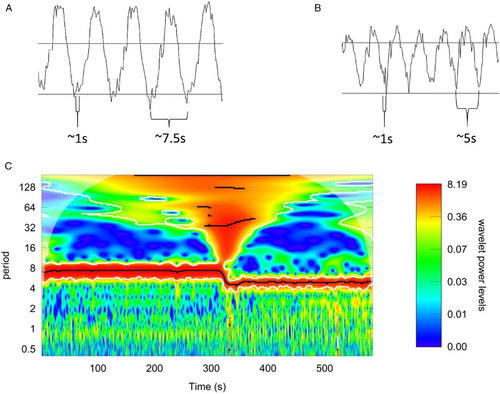
Figure 3 (A) Lomb–Scargle periodogram – dashed line denotes threshold of statistical significance (P-value of 0.05). Oscillations with normalized power above dashed line are statistically significant. (B) Observed signal (red), dominating the sinusoid contribution (black), and the difference between these two (blue) that represents oscillations induced by the cardiac action.
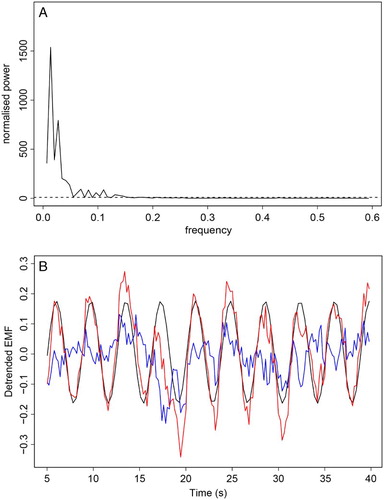
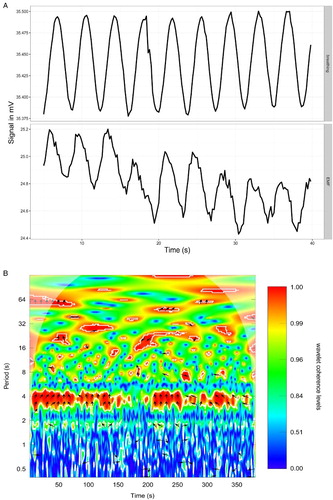
Figure 4 (A) Alignment between raw data from oxygenation sensor in breathing air (upper panel) and the redox potential difference between arterial and venous blood (lower panel). The oxygenation data increase with inhalation and decrease with exhalation. (B) Wavelet coherence analysis of oxygenation signal and redox potential. Areas delineated by white contour are areas with significance level of 0.1. Arrows indicate phase difference and are placed in areas of P-value of 0.05 or lower.