Figures & data
Figure 1 Homocysteine pre-treatment increases the disulfide reduction capacity of MDA-MB231 human breast cancer cells and BAEC. (A) Time-course curves of the disulfide reduction capacity of intact cells after pre-treatments with different concentrations of homocysteine, as described in Material and Methods. Estrogen receptor-negative MDA-MB-231 human breast cancer cells were pre-treated for 4 hours with 0 mM (rhombus), 0.05 mM (circles), 0.5 mM (triangles), or 5 mM (squares) homocysteine. Values for 0.5 and 5 mM homocysteine pre-treatments were statistically significant as compared with those of controls (P < 0.05 and P < 0.01, respectively). (B) Time-course curves of the disulfide reduction capacity of intact cells after different pre-treatment times with 5 mM homocysteine: controls (circles) and 1 hour (rhombus), 4 hours (squares), and 24 hours (triangles). Values for 1 and 4 hours of pre-treatment with 5 mM homocysteine were statistically significant as compared with those of controls (P < 0.01). (C) The total disulfide reduction capacity of intact BAEC after 4 hours of pre-treatments with or without 5 mM homocysteine was measured, as described in Material and Methods. Activity values after different times of incubation in arbitrary units are represented for control, untreated cells (gray bars) and 5 mM homocysteine-treated cells (black bars). Depicted data are means ± S.D. of values of three independent experiments. From 20 minutes on, values for 4 hours of pre-treatment with 5 mM homocysteine were statistically significant as compared with those of controls (P < 0.01).
Figure 2 Cysteine cannot fully mimic the effects of homocysteine on the disulfide reduction capacity of intact cells. The disulfide reduction capacity of intact MDA-MB-231 human breast cancer cells (A) and BAEC (B) after 4 hours of pre-treatments with (squares) or without (circles) 5 mM cysteine was measured, as described in Material and Methods. Depicted data are means ± S.D. of values of three independent experiments. Values for 4 hours of pre-treatment with 5 mM cysteine were statistically significant in BAEC as compared with those of controls (P < 0.05).
Figure 3 Homocysteine thiolactone cannot mimic the effects of homocysteine on the disulfide reduction capacity of intact cells. The disulfide reduction capacity of intact MDA-MB-231 human breast cancer cells (A) and BAEC (B) after 4 hours of pre-treatments with (squares) or without (circles) 5 mM homocysteine thiolactone was measured, as described in Material and Methods. Depicted data are means ± S.D. of values of three independent experiments. Values for 4 hours of pre-treatment with 5 mM homocysteine thiolactone were statistically significant in BAEC as compared with those of controls (P < 0.05).
Figure 4 Pre-treatments in the absence of serum reveal different effects of homocysteine thiolactone on MDA-MB231 human breast cancer cells and BAEC disulfide reduction capacity. The disulfide reduction capacity of intact MDA-MB-231 human breast cancer cells (A and C) and BAEC (B and D) after 4 hours of pre-treatments with (squares) or without (circles) 5 mM homocysteine (A, B) or 5 mM homocysteine thiolactone (C and D) was measured, as described in Material and Methods. Depicted data are means ± S.D. of values of three independent experiments. In (A), (B), and (D) (but not in C) values for pre-treated samples were statistically significant as compared with those of controls (P < 0.05).
Figure 5 Effects of the pre-treatments on the morphology of MDA-MB231 human breast cancer cells. Photographs were taken of MDA-MB231 human breast cancer cells after 4 hours of treatment in the absence (control) or presence of 5 mM homocysteine (Hcy) or homocysteine thiolactone (Hcy T). Photographs were taken at a 200× magnification under a Nikon Eclipse TI microscope. Representative images are shown. Three independent experiments were carried out with similar results.
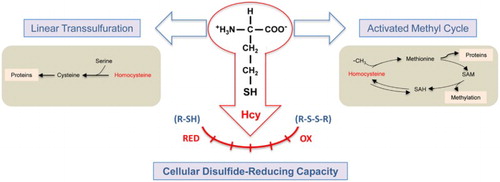
Figure 6 Some major metabolic and modulatory functions of homocysteine. To the well-known metabolic roles of homocysteine as an intermediate metabolite in both the lineal trans-sulfuration pathway and the activated methyl cycle, our results add a relevant modulatory effect of this amino acid on cellular disulfide-reducing capacity.