Figures & data
Figure 1. Pg is sensitive to oxidation in CRC. (a) Pg was detected after BIAM- SA precipitation in tumor tissue (pT) and adjacent normal tissue (pN). BIAM-labeled and unlabeled Pg were considered reduced (red) or oxidized (ox), respectively. Arrows indicate Pg. (b) The ox/red ratio was calculated based on the band densities of oxidized and reduced Pg. n = 5 for each group. (c) Pg oxidation was analyzed by 2-DE in pN and pT samples of patients with stage III CRC. Arrowheads indicate the location of the Pg spots. (d, e) After exposing CRC cells, MCF-7 cells, and normal mouse colon tissue (mColon) to H2O2, oxidation of Pg was detected using the BIAM-SA method and the ox/red ratio was calculated in HCT-116, MCF-7, and normal mColon. n = 3 for each group. (f) Pg oxidation by H2O2 treatment was confirmed using two-2-DE in HCT-116 and MCF-7 cells. Values are presented as mean ± standard error of the mean (SEM). *P < 0.05.
Figure 2. C457S of Pg is potentially redox-sensitive. (a, b) MC38 cells transfected with mock vector or either WT, C420S, or C457S Pg were treated with 1 mM H2O2 and the Pg protein level was evaluated. n = 2 for each group. (c, d) Proteins extracted from MC38 cells transfected with mock vector or WT, C420S, or C457S Pg were treated with 0 or 1 mM H2O2 and the oxidation of Pg was detected and analyzed using the BIAM-SA method. Values are presented as mean ± SEM.
Figure 3. C457S influences E-cadherin/catenins interactions. (a, b) MC38 cells co-transfected with E-cadherin plus WT or mutant Pg were incubated with or without FGF-2 for 3 h, after which the levels of cadherin and catenin expression were evaluated. (c, d) Levels of catenin interacting with E-cadherin were analyzed using IP with GFP in the absence or presence of FGF-2. (e, f) Levels of cadherin/catenin interacting with Pg were analyzed using IP with Pg. Values are presented as mean ± SEM. *P < 0.05 vs. Mock, #P < 0.05 vs. WT, §P < 0.05 vs. without FGF-2.
Figure 4. C457S alters the cellular localization of Pg. (a–c) Cellular distributions of E-cadherin (green), Pg (red), α-catenin (red), and β-catenin (red) were examined in MC38 cells expressing WT, C420S, and C457S Pg using immunofluorescent analysis. DAPI (blue) was used to stain cell nuclei. Scale bar = 10 μm.
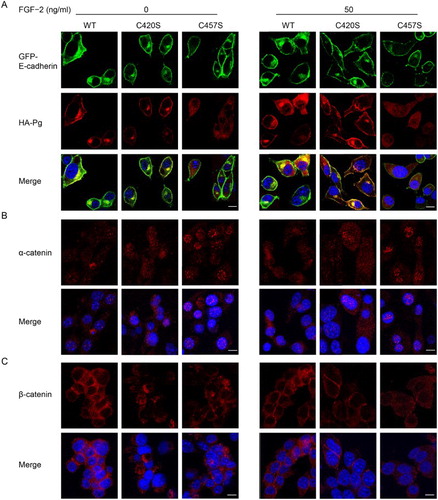
Figure 5. The expression in β-catenin target genes. The mRNA expression levels of Vim, c-Myc, Ccnd1, and Fn1 were assessed in MC38 cells transfected with mock vector or WT, C420S, or C457S Pg and treated with 0 or 50 ng/ml of FGF-2. Values are presented as mean ± SEM. *P < 0.05 vs. WT, #P < 0.05 vs. without FGF-2. n = 3 for each group.
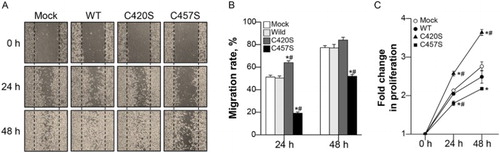
Figure 6. C457S Pg reduces MC38 cell migration and proliferation. (a, b) After scratch-wounding cell monolayers, photographs were taken at 0, 24, and 48 h. (c) The proliferation of cells expressing WT or mutant Pg was assayed using thiazolyl blue tetrazolium bromide (MTT) assay every 24 h for 2 days. Cell migration and proliferation levels are shown as the mean ± SEM of three independent experiments. *P < 0.05 vs. Mock, #P < 0.05 vs. WT.