Figures & data
Figure 1. Effect of NAC on 3T3-L1 cells at 10 days of differentiation. Control cells (CC); MDI-treated cells (DC); MDI + 0.01 mM NAC-treated cells (DCN-0.01); MDI + 5 mM NAC-treated cells (DCN-5). Representative results from one of four independent experiments with similar results are shown.
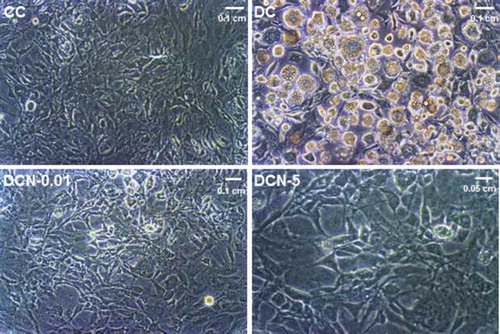
Figure 2. Kinase phosphorylation in response to NAC treatment. Comparison of control cells (CC); Vehicle + NAC-treated cells (CCN); MDI cells (DC); MDI + NAC-treated cells (DCN-0.01: 0.01 mM NAC; DCN-0.05: 0.05 mM NAC; DCN-1: 1 mM NAC; DCN-5: 5 mM NAC). Values represent the fold decrease in protein expression compared with DC. Bars show the average of four different experiments (means ± SD). Representative results from one of independent western blot experiments with similar results are shown. The results are expressed as arbitrary units, *p < 0.01 CC, CCN or DCN vs. DC. (a) JNK½ phosphorylation. Results were normalized to JNK expression, (F = 59.32, degrees of freedom = 21). (b) ERK½ phosphorylation. The results were normalized to ERK and β-actin expression, (F = 39.40, degrees of freedom = 21).
Figure 3. Kinase phosphorylation is abrogated when pre-treated with inhibitors to JNK½ or ERK½. Cells were pre-treated for 2 hours with JNK (SP600125) or ERK (UO126) inhibitor and then treated with MDI (DC) or MDI + 5 mM NAC (DCN-5). Representative results from one of independent western blot experiments with similar results are shown. (a) JNK½ phosphorylation was assessed via western blot analysis and compared to JNK. (b) ERK½ phosphorylation was assessed via western blot analysis and compared to ERK.
Figure 4. Effect of NAC on 3T3-L1 cells during MCE. Comparison of control cells (CC); MDI cells (DC); MDI + NAC-treated cells (DCN). Cells were harvested at day 1 (DC 24 hours, DCN 24 hours) or at day 2 (DC 48 hours, DCN 48 hours) of the differentiation protocol. The concentration of NAC is shown. Cells were counted and, viable cells were evaluated by trypan blue stain exclusion. Data represent the percentage of CC. Results are the average of four different experiments (mean ± SD).
Figure 5. CS (a), FH (b) and MAOA (c) expression in response to NAC treatment. Comparison of MDI cells (DC) and MDI + NAC-treated cells (DCN-0.01: 0.01 mM NAC; DCN-1: 1 mM NAC). Values represent the fold increase or decrease in protein expression compared with DC. Results were normalized to TOMM22 expression. Bars show the average of two different experiments (mean ± SD). Representative results from one of two independent western blot experiments performed in duplicate with similar results are shown. The results are expressed as arbitrary units, *p < 0.01 DCN vs. DC, (CS (a): F = 94.77, degrees of freedom = 9; FH (b): F = 31.97, degrees of freedom = 9; MAOA (c): F = 162.81 degrees of freedom = 9).