Figures & data
Table 1. Characteristics of study participants (mean ± SE).
Table 2. Results of study participants’ medical qualifications (mean ± SE).
Table 3. Lactate concentration changes and acid–base balance indicators in the blood after anaerobic exercise (mean ± SE).
Table 4. Changes of LDH, CK and XO activity, after anaerobic exercise (mean ± SE).
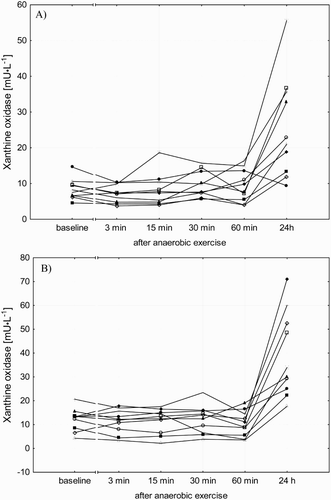
Figure 1. Individual results of XO activity in the blood plasma of men (a) and women (b) after anaerobic exercise.