Figures & data
Figure 1. DPPH free radical scavenging rate of C. fructus.
Note: Each value represents the mean ± SD. NAC, N-acetyl-L-cysteine.
Figure 2. Effects of C. fructus on serum ALT and AST activities.
Note: A, Serum ALT activity; B, Serum AST activity. ALT, alanine aminotransferase; AST, aspartate aminotransferase; NC, normal control group; alcohol group, treated with 50% alcohol (10 mL/kg, 4g/kg); LCF + alcohol group, treated with 50 mg/kg of C. fructus and alcohol; MCF + alcohol group, treated with 100 mg/kg of C. fructus and alcohol; HCF + alcohol group, treated with 200 mg/kg of C. fructus and alcohol; SI + alcohol group, treated with 50 mg/kg of silybin and alcohol.*P < 0.05; **P < 0.01 compared with the NC group; #P < 0.05 and ##P < 0.01 compared with the alcohol-treated groups.
Figure 3. Effect of C. fructus on TBARS.
Note: TBARS, thiobarbituric acid reactive substances; NC, normal control group; alcohol group, treated with 50% alcohol (10 mL/kg, 4g/kg); LCF + alcohol group, treated with 50 mg/kg of C. fructus and alcohol; MCF + alcohol group, treated with 100 mg/kg of C. fructus and alcohol; HCF + alcohol group, treated with 200 mg/kg of C. fructus and alcohol; SI + alcohol group, treated with 50 mg/kg of silybin and alcohol. *P < 0.05 compared with the NC group; #P < 0.05 compared with the alcohol-treated groups.
Figure 4. Effect of C. fructus on the inhibition of free hydroxyl radicals.
Note: NC, normal control group; alcohol group, treated with 50% alcohol (10 mL/kg, 4g/kg); LCF + alcohol group, treated with 50 mg/kg of C. fructus and alcohol; MCF + alcohol group, treated with 100 mg/kg of C. fructus and alcohol; HCF + alcohol group, treated with 200 mg/kg of C. fructus and alcohol; SI + alcohol group, treated with 50 mg/kg of silybin and alcohol. *P < 0.05 compared with the NC group; #P < 0.05 compared with the alcohol-treated groups.
Figure 5. Effect of C. fructus on GSH-Px (A), T-SOD (B), and GSH (C).
Note: NC, normal control group; alcohol group, treated with 50% alcohol (10 mL/kg, 4g/kg); LCF + alcohol group, treated with 50 mg/kg of C. fructus and alcohol; MCF + alcohol group, treated with 100 mg/kg of C. fructus and alcohol; HCF + alcohol group, treated with 200 mg/kg of C. fructus and alcohol; SI + alcohol group, treated with 50 mg/kg of silybin and alcohol. *P < 0.05 compared with the NC group; #P < 0.05 and ##P < 0.01 compared with the alcohol-treated groups.
Figure 6. Effect of C. Fructus on CYP2E1 activity (A) and protein expression (B).
Note: NC, normal control group; alcohol group, treated with 50% alcohol (10 mL/kg, 4g/kg); LCF + alcohol group, treated with 50 mg/kg of C. fructus and alcohol; MCF + alcohol group, treated with 100 mg/kg of C. fructus and alcohol; HCF + alcohol group, treated with 200 mg/kg of C. fructus and alcohol; SI + alcohol group, treated with 50 mg/kg of silybin and alcohol. **P < 0.01 compared with the NC group; #P < 0.05 and ##P < 0.01 compared with the alcohol-treated groups.
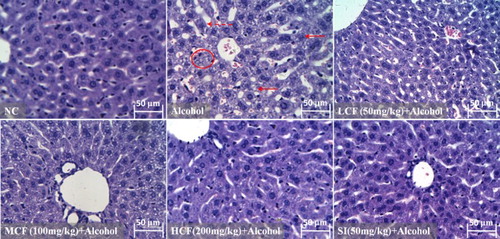
Figure 7. Effect of C. fructus on alcohol-induced histopathological changes in the livers of mice (original magnification 400×).
Note: NC, normal control group; alcohol group, treated with 50% alcohol (10 mL/kg, 4g/kg); LCF + alcohol group, treated with 50 mg/kg of C. fructus and alcohol; MCF + alcohol group, treated with 100 mg/kg of C. fructus and alcohol; HCF + alcohol group, treated with 200 mg/kg of C. fructus and alcohol; SI + alcohol, group, treated with 50 mg/kg of silybin and alcohol. The mice were exposed to alcohol (10 mL/kg) or different concentrations of C. Fructus (50, 100, and 200mg/kg body weight/d) for 3 days. Increased hepatic sinus gaps; : hepatic steatosis; : damaged liver cells.