Figures & data
Scheme 1. Possible pathways involved in the photosensitized oxidation of CTQ, CTC, and RSC. S represents the photosensitizer and dCTQ denotes generically to the substrates CTQ, CTC, and RSC.
Scheme 2. Chemical structures of CTQ, CTC, RSC, RB, and Rf.
Figure 1. Spectral changes of 0.4 mM CTQ + 0.02 mM Rf vs. 0.02 mM Rf upon visible-light photoirradiation, in buffer pH 7 (main figure) and in buffer pH 9 (insert). Numbers on the spectra represent irradiation time, in seconds.
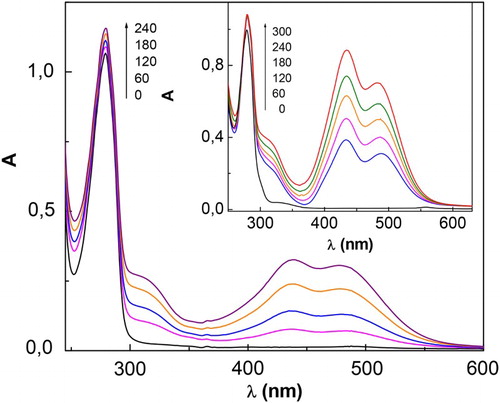
Figure 2. Spectral changes of 0.7 mM RSC + 0.02 mM Rf vs. 0.02 mM Rf, upon visible-light photoirradiation. Insert: spectral changes for 0.4 mM CTC + 0.02 mM Rf vs. 0.02 mM Rf, upon visible-light photoirradiation. Solvent: buffer pH 7. Numbers on the spectra represent irradiation time, in seconds.
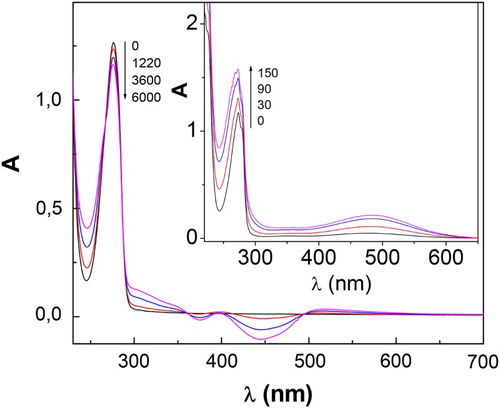
Figure 3. Profiles of oxygen consumption, upon Rf-sensitized photoirradiation (a) CTC, (b) CTQ, and (c) RSC, in buffer pH 7 (main figure) and pH 9 (insert). [dCTQ] = 0.4 mM.
![Figure 3. Profiles of oxygen consumption, upon Rf-sensitized photoirradiation (a) CTC, (b) CTQ, and (c) RSC, in buffer pH 7 (main figure) and pH 9 (insert). [dCTQ] = 0.4 mM.](/cms/asset/9520f804-ec3a-4003-a3db-33f446cd0c52/yrer_a_1240287_f0003_c.jpg)
Table 1 Relative rates of oxygen consumption by CTQ, CTC, and RSC, sensitized by RB (A556 nm = 0.6) and 0.02 mM Rf. Solvents: buffer pH 7 and buffer pH 9.
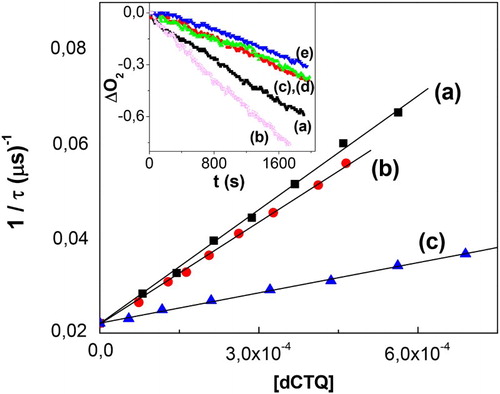
Figure 4. Stern–Volmer plot for the quenching of O2 -phosphorescence emission by dCTQ: (a) CTQ, (b) CTC, and (c) RSC, upon RB-sensitized photoirradiation, in D2O pD 7. Inset: profiles of oxygen consumption, in buffer pH 7, upon Rf-sensitized photoirradiation (a) 0.02 mM Rf + 0.4 mM CTQ; (b) 0.02 mM Rf + 0.4 mM CTQ + 1 mg/100 ml SOD; (c) 0.02 mM Rf + 0.4 mM CTQ + 10 mM NaN3; (d) 0.02 mM Rf + 0.4 mM CTQ + 1 mg/100 ml CAT; (e) 0.02 mM Rf + 0.4 mM CTQ + 1.0 mM D-Mannitol (1.0 mM).