Figures & data
Figure 1. GC–MS profiling of flax seed oil: fatty acid distribution peaks, n = 3.
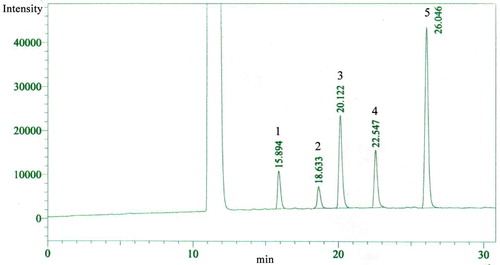
Table 1. Fatty acid composition of FSO.
Figure 2. Effect of FSO on arsenic deposition in heart: data represented as mean ± SD, n = 6. aP < 0.05 vs. normal control, bP < 0.05 vs. As2O3 (4 mg/kg b.wt).
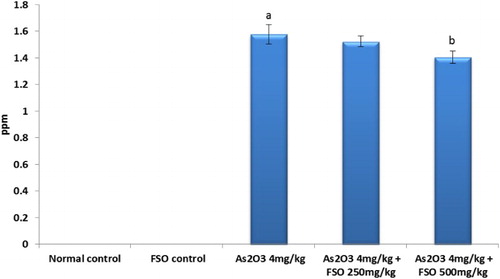
Figure 3. Effect of FSO and As2O3 on serum cholesterol and triglyceride: data represented as mean ± SD, n = 6.
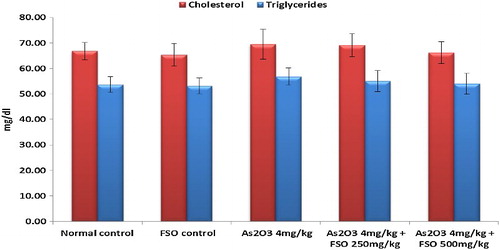
Table 2. Cardiac marker enzymes.
Table 3. Antioxidant status of heart.
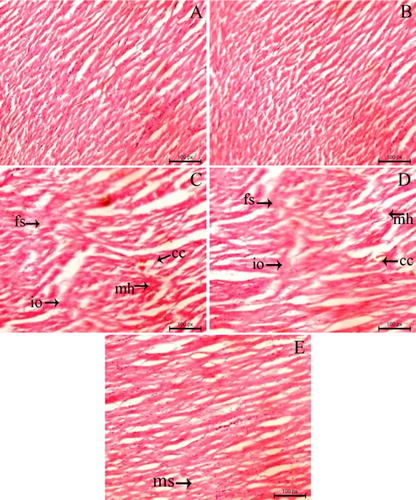
Figure 4. Histopathology of heart tissue: histopathological changes occurred in rat heart tissues after As2O3 administration and its amelioration with FSO treatment (Hematoxylin and Eosin, 100×). (a) – normal control; (b) – FSO (500 mg/kg b.wt); (c) – As2O3 (4 mg/kg b.wt); (d) – As2O3 (4 mg/kg b.wt) + FSO (250 mg/kg b.wt), (e) – As2O3 (4 mg/kg b.wt) + FSO (500 mg/kg b.wt). fs – fibre separations, io – interstitial oedema, cc – capillary congestion, mh – micro-haemorrhages, ms – mild swelling.