Figures & data
Table 1. Effects of gender and training on body weight at the end of the protocol.
Figure 1. Effects of gender and training on (a) oxygen consumption VO2, (b) ATP production VATP, and (c) •OH production V•OH rates in permeabilized gastrocnemius muscle fibers of untrained (white histogram) and trained Wistar rats (gray histogram). VO2 and VATP were measured in the absence (V0) and in the presence (Vmax) of ADP and V•OH was measured only in the presence of ADP. Values are means ± SEM. A two-way ANOVA and Student’s t-tests were used to compare trained vs. untrained and female vs. male rats. *P < 0.05, **P < 0.01, ***P < 0.001. Nd = not detected and Nm = not measured.
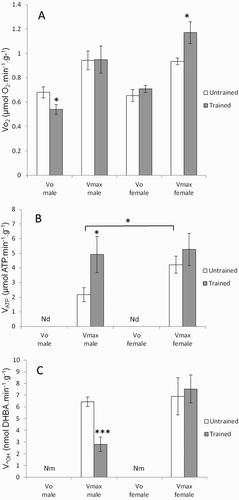
Figure 2. Effects of gender and training on the vulnerability of mitochondrial function to ROS exposure. Oxygen consumption VO2 was measured under V0 and Vmax conditions, and VATP under Vmax conditions, in permeabilized gastrocnemius muscle fibers of untrained (white histogram) and trained rats (gray histogram). VO2(max) and VATP were measured after 30 minutes of incubation in buffer A containing H2O2 + FeCl2 for treated fibers and in buffer A alone for untreated fibers. The change in respiratory and ATP rates is expressed relative to fibers without H2O2 and FeCl2 according to this formula: [(VTreated−VUntreated)/VUntreated] × 100. Values are means ± SEM. A two-way ANOVA and the Student’s t-tests were used to compare trained vs. untrained and female vs. male rats. *P < 0.05, **P < 0.01, ***P < 0.001.
![Figure 2. Effects of gender and training on the vulnerability of mitochondrial function to ROS exposure. Oxygen consumption VO2 was measured under V0 and Vmax conditions, and VATP under Vmax conditions, in permeabilized gastrocnemius muscle fibers of untrained (white histogram) and trained rats (gray histogram). VO2(max) and VATP were measured after 30 minutes of incubation in buffer A containing H2O2 + FeCl2 for treated fibers and in buffer A alone for untreated fibers. The change in respiratory and ATP rates is expressed relative to fibers without H2O2 and FeCl2 according to this formula: [(VTreated−VUntreated)/VUntreated] × 100. Values are means ± SEM. A two-way ANOVA and the Student’s t-tests were used to compare trained vs. untrained and female vs. male rats. *P < 0.05, **P < 0.01, ***P < 0.001.](/cms/asset/ff375dce-888a-4d74-ba45-ae67c203a0bc/yrer_a_1296637_f0002_b.gif)
Figure 3. Effects of gender and training on SOD (U/mg protein), CAT (H2O2/minute/mg protein), and Gpx(μmol NADPH oxidized/minute/mg protein) in gastrocnemius muscle of untrained (white histogram) and trained rats (gray histogram). Values are means ± SEM. A two-way ANOVA and the Student’s t-tests were used to compare trained vs. untrained and female vs. male rats, **P < 0.01, ***P < 0.001.
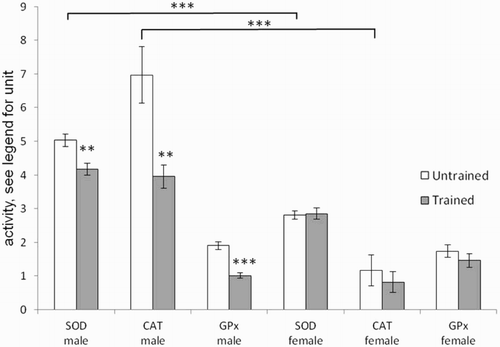
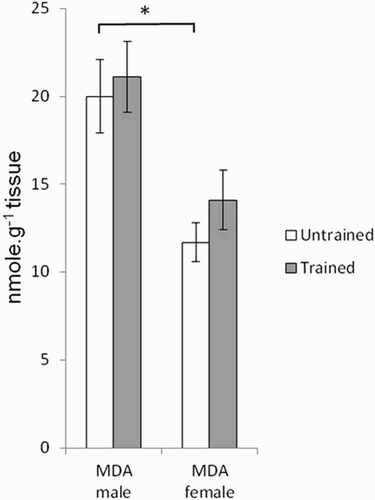
Figure 4. Effects of gender and training on MDA (lipid peroxidation index) content in gastrocnemius muscle of untrained (white histogram) and trained rats (gray histogram). Values are means ± SEM. A two-way ANOVA and the Student’s t-tests were used to compare trained vs. untrained and female vs. male rats, *P < 0.05.