Figures & data
Figure 1. Antioxidants’ contribution in regulation and mechanism of action of cariogenic bacteria. Response of S. mutans to oxidative stress caused by ROS produced by neutrophils, fibroblasts, and other cells of the oral cavity is accompanied by, e.g. increased response from the bacterial enzymatic systems as intracellular NADH oxidase (Nox) in the SpxA1/ SpxB/ Rex-dependent modulation, and proteins that affect cellular redox status and are involved in the regulation of S. mutans’s metabolism. Antioxidant systems of the host (e.g. salivary GSH, GSSG, TAC) and exogenous factors (e.g. diet and hygienic habits) act in addition to antioxidant systems of bacteria.
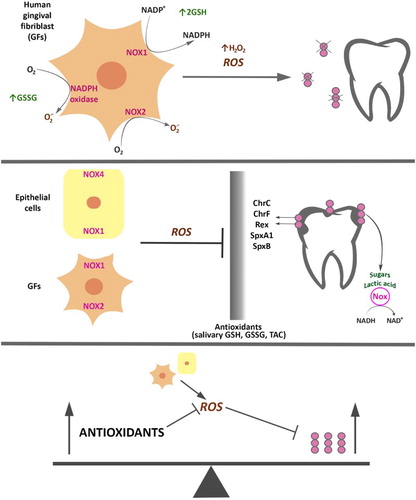
Figure 2. Morphological assessment of Streptococcus sp. bacteria. Photograph shows macro- and micromorphology of Streptococcus sp. 1 – S. mutans colonies with characteristic white coloration on the tested medium; 2 – on blood agar (BA); 3 – S. mutans cells in Gram-stained preparation. Photograph 3 taken with an Olympus CX41 microscope, coupled to a CaMedia C5550 camera; 4 – S. mutans cells in a JEOL JSM-35CF SEM.
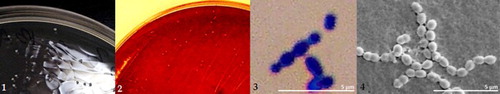
Figure 3. The percentage share of individual bacterial strains isolated from saliva of children with cavitated ECC, non-cavitated ECC, and children without symptoms of the disease.
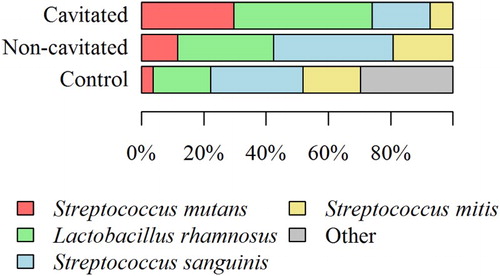
Figure 4. (a). Salivary reduced-glutathione levels in all groups with ECC and in the control group. The median and interquartile range (box), and percentile 5–95% range (whiskers) are shown; P-values are given for the comparison of groups with each other (***P < 0.001 post-hoc Mann–Whitney test with Bonferroni correction). Cavitated patients with ECC; non-cavitated patients with ECC; control without lesions. (b). Salivary GSSG levels in all groups with ECC and in the control group. The median and interquartile range (box), and percentile 5–95% range (whiskers) are shown; P-values are given for the comparison of groups with each other (***P < 0.001 post-hoc Mann-–Whitney test with Bonferroni correction). Cavitated patients with ECC; non-cavitated patients with ECC; control without lesions. (c). Salivary TAC levels in all groups with ECC and in the control group. The median and interquartile range (box), and percentile 5–95% range (whiskers) are shown; P-values are given for the comparison of groups with each other (***P < 0.001 post hoc Mann–Whitney test with Bonferroni correction). Cavitated patients with ECC; non-cavitated patients with ECC; control without lesions.
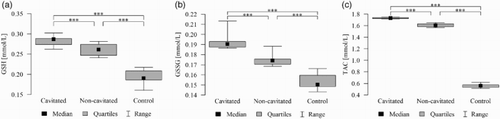
Table 1. Adjusted relationships between reduced glutathione, oxidized glutathione and TAC and salivary bacterial profiles and dental caries progression.
Table 2. Relationship between salivary glutathione and TAC levels, and salivary bacterial profiles and dental caries.
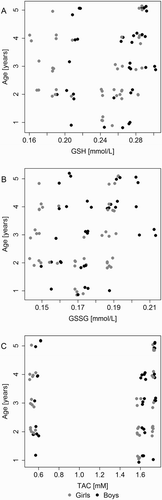
Figure 5. Scatterplots of the relationship between change in (a) GSH and age, (b) GSSG and age, and (c) TAC and age.