Figures & data
Table 1. Cardiac antioxidant enzyme profile following exposure and withdrawal of sodium arsenite.
Table 2. Renal antioxidant enzyme profile following exposure and withdrawal of sodium arsenite.
Table 3. Cardiac thiols and markers of oxidative stress following exposure and withdrawal of sodium arsenite.
Table 4. Renal thiols and markers of oxidative stress following exposure and withdrawal of sodium arsenite.
Table 5. Plasma creatinine and urea profile following exposure and withdrawal of sodium arsenite.
Figure 1. Immunohistochemistry of protein kinase B (PKB) in the heart of rats exposed to sodium arsenite for 4 weeks. (A) Control: shows positive and high expression of PKB; (B) 10 mg/kg NaAsO2: shows lower expression of PKB than control: (C) 20 mg/kg NaAsO2 shows lower expression of PKB than control; (D) 40 mg/kg NaAsO2: shows no expression of PKB. The result is indicative that exposure of rats to NaAsO2 reduced the expressions of survival protein (Akt/PKB). Scale bar (for A, B, C and D) = 5.04 × 3.87 mm. The slides were counterstained with high definition hematoxylin and viewed ×400 objectives.
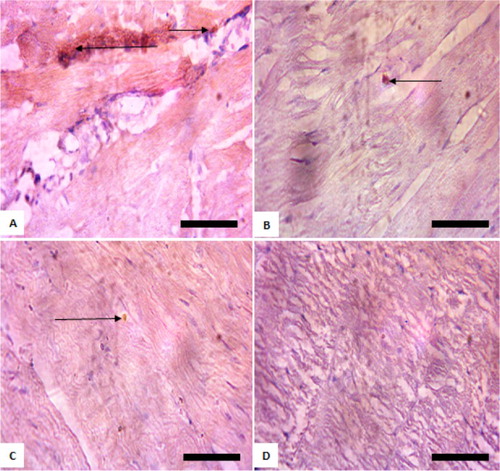
Figure 2. Immunohistochemistry of protein kinase B (PKB) in the kidneys of rats exposed to sodium arsenite for 4 weeks. (A) Control: shows positive expression of PKB; (B) 10 mg/kg NaAsO2 shows lower expression of PKB than control; (C) 20 mg/kg NaAsO2 shows no expression PKB; (D) 40 mg/kg NaAsO2: shows no expression PKB. The result is indicative that exposure of rats to NaAsO2 reduced the expressions of survival protein (Akt/PKB). Scale bar (for A, B, C, and D) = 5.04 × 3.87 mm. The slides were counterstained with high definition hematoxylin and viewed ×400 objectives.
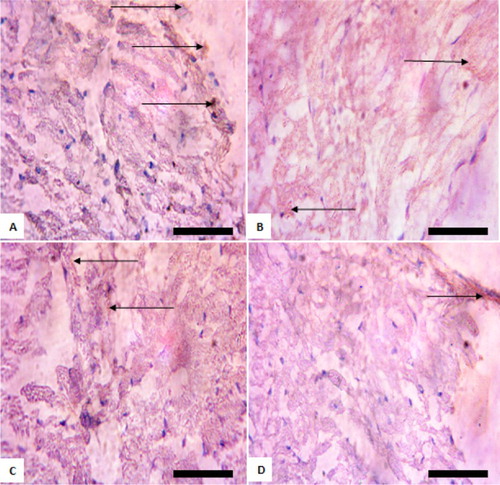
Figure 3. Immunohistochemistry of protein kinase B (PKB) in the heart of rats after withdrawal of sodium arsenite exposure for 4 weeks. (A) Control: shows positive and high expression of PKB; (B) 10 mg/kg NaAsO2: shows lower expression of PKB than control; (C) 20 mg/kg NaAsO2 shows lower expression of PKB than control; (D) 40 mg/kg NaAsO2: shows lower expression of PKB than control. The result shows that following withdrawal of NaAsO2, the expressions of the survival protein (Akt/PKB) are still lower than the control. Scale bar (for A, B, C, and D) = 5.04 × 3.87 mm. The slides were counterstained with high definition hematoxylin and viewed ×400 objectives.
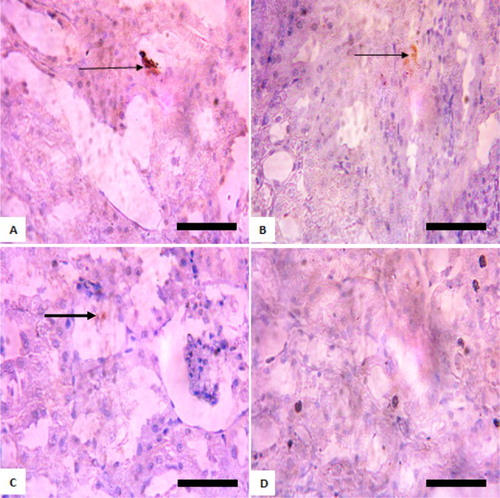
Figure 4. Immunohistochemistry of protein kinase B (PKB) in the kidneys of rats after withdrawal of sodium arsenite exposure for 4 weeks. (A) Control: shows positive and high expression of PKB; (B) 10 mg/kg NaAsO2 shows lower expression of PKB than control; (C) 20 mg/kg NaAsO2: shows no expression of PKB; (D) 40 mg/kg NaAsO2: shows no expression of PKB. The result shows that following withdrawal of NaAsO2, the expressions of the survival protein (Akt/PKB) are still lower than the control. Scale bar (for A, B, C, and D) = 5.04 × 3.87 mm. The slides were counterstained with high definition hematoxylin and viewed ×400 objectives.
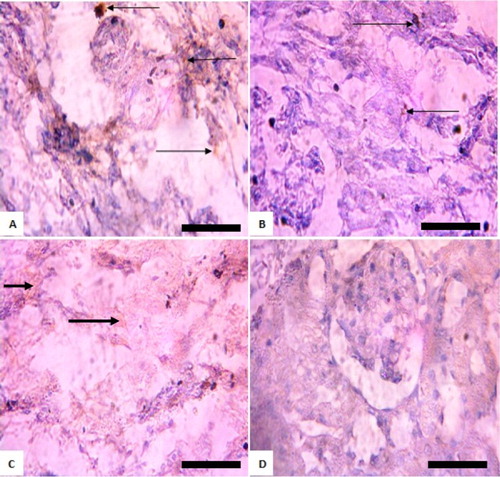
Figure 5. Photomicrograph showing heart of rats exposed to sodium arsenite orally for 4 weeks. (A) Control shows no significant lesion; (B) 10 mg/kg NaAsO3 mild pyknosis and necrotic cells (black arrows); (C) 20 mg/kg NaAsO3 reveals loss of striations and pyknotic cells (black arrows) and (D) 40 mg/kg NaAsO3 with loss of structural architecture, severe pyknosis and necrosis of cells (black arrows). Scale bar (for A, B, C and D) = 2.15 × 2.79 mm Plates are stained with H and E stains and viewed with ×100 objectives.
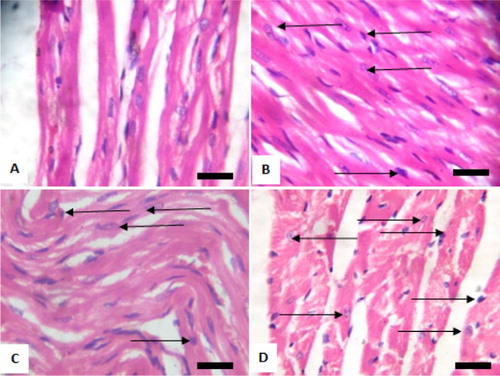
Figure 6. Photomicrograph showing heart of rats post withdrawal of sodium arsenite for 4 weeks. (A) Control; (B) 10 mg/kg NaAsO3 mild myocardial damage with pyknotic cells (black arrows); (C) 20 mg/kg NaAsO3 moderate myocardial damage with pyknotic cells (black arrows) and (D) 40 mg/kg NaAsO3 severe myocardial damage with pyknotic cells (black arrows). Scale bar (for A, B, C and D) = 2.15 × 2.79 mm. Plates are stained with H and E stained and viewed with ×100 objectives.
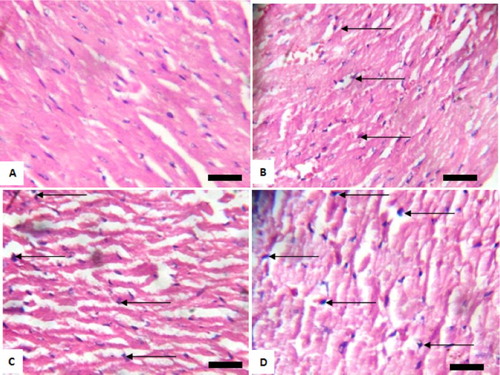
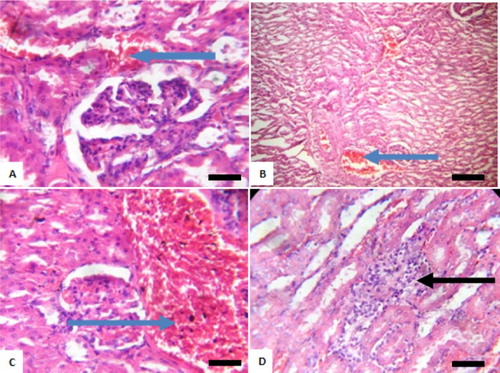
Figure 7. Photomicrograph showing kidney of rats exposed to sodium arsenite orally for 4 weeks. (A) Control shows focal hemorrhagic lesion (blue arrow); (B) 10 mg/kg NaAsO2 with peritubular infiltration by inflammatory cells (black arrow) and mild tubular necrosis (green arrow); (C) 20 mg/kg NaAsO2 showing congestion of vessel (blue arrow) and (D) 40 mg/kg NaAsO2 showing congestion of vessels (blue arrow) and peritubular infiltration by inflammatory cells (black arrow). Scale bar (for A, B, C and D) = 2.15 × 2.79 mm. Plates are stained with H and E stains and viewed with 100 objectives.
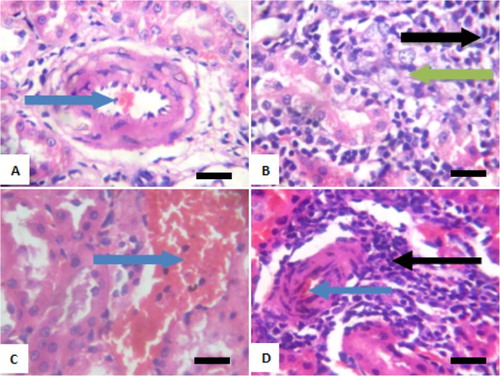
Figure 8. Photomicrograph showing kidneys of rats post withdrawal of sodium arsenite for 4 weeks. (A) Control with mild congestion of blood vessel (blue arrow); (B) 10 mg/kg NaAsO2 shows congestion of vessel (blue arrow); (C) 20 mg/kg NaAsO2 with marked disseminated congestion of blood vessel (blue arrow) and (D) 40 mg/kg NaAsO2 shows focal area of peritubular inflammation (black arrow). Scale bar (A, B, C and D) = 2.15 × 2.79 mm. Plates are stained with H and E stains and viewed with ×100 objectives.