Figures & data
Table 1. Composition and energy content of diets.
Table 2. Rat Genome Database (RGD) accession numbers and primer sequences of genes selected for qRT-PCR.
Table 3. Biometric, biochemical and cardiovascular parameters of rats fed a control diet (CT) or a high-fat diet (FAT), and submitted to physical training (PT) or kept sedentary (SED).
Figure 1. (A) Activity of enzyme superoxide dismutase (SOD, U/mg protein; n = 5–6), (B) activity of the enzyme catalase (CAT, U/mg protein, n = 9–13), (C) reduced glutathione (GSH, nmol/ml, n = 5–11), (D) oxidized glutathione (GSSG, nmol/ml, n = 7–12) and (E) GSH/GSSG ratio (n = 5–9) in liver of rats fed a high-fat diet (30% fat, FAT) or a control diet (AIN-93, CT) for 13 weeks and submitted to physical training (PT), or maintained sedentary (SED) during the last 6 weeks of the diet. *P < 0.05 compared to CT-SED group. #P < 0.05 compared to FAT-SED group (two-way ANOVA followed by Bonferroni post-test).
Figure 2. (A) Concentrations of malondialdehyde (MDA, U/mg of protein; n = 5–10) by concentrations of thiobarbituric acid-reactive substances (TBARS) method and (B) carbonyl proteins (nmol/mg of protein, n = 6) in the liver of rats fed a high-fat diet (30% fat, FAT) or a control diet (AIN-93, CT) for 13 weeks and submitted to physical training (PT) or maintained sedentary (SED) during the last 6 weeks of the diet. *P < 0.05 compared to CT-SED group. #P < 0.05 compared to FAT-SED group (two-way ANOVA followed by Bonferroni post-test).
Figure 3. Evaluation of gene expression (U.A.) of insulin signaling pathway mediators (n = 3–4) and peroxisome proliferator-activated receptor gamma (PPARγ, n = 4) in the liver of rats fed a high-fat diet (30% fat, FAT) or a control diet (AIN-93, CT) for 13 weeks and submitted to physical training (PT) or maintained sedentary (SED) during the last 6 weeks of the diet. (A) Insulin receptor (IR), (B) Insulin receptor substrate 1 (IRS-1), (C) Insulin receptor substrate 2 (IRS-2) (D) serine/threonine kinase 2 (AKT-2), (E) glucose transporter type 4 (GLUT4), (F) peroxisome proliferator-activated receptor gamma (PPARγ). *P < 0.05 compared to CT-SED group. #P < 0.05 compared to FAT-SED group (two-way ANOVA followed by Bonferroni post-test).
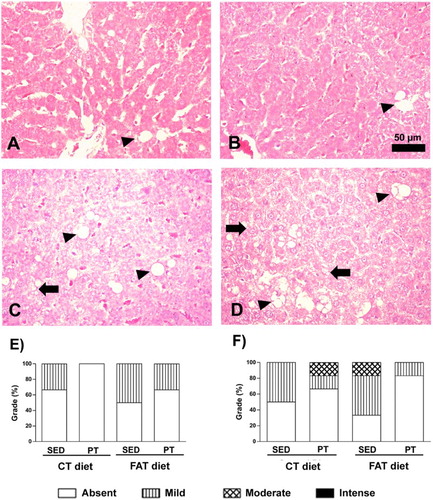
Figure 4. Photomicrographs of liver stained with hematoxylin and eosin (HE). Arrow indicates microvesicular steatosis, and arrowhead indicates macrovesicular steatosis. (A) Rat fed with a control (CT) diet and maintained sedentary (SED). (B) Rat submitted to a control (CT) diet and physical training (PT). (C) Rat submitted to a high-fat (FAT) diet and maintained sedentary (SED). (D) Rat submitted to a high-fat (FAT) diet and physical training (PT). Magnification 440×. Bar = 50 μ. Qualitative evaluation of macrovesicular steatosis (E) and microvesicular steatosis (F) in liver tissue, using a grade from absent to mild, moderate or intense.