Figures & data
Figure 1. Experimental protocol for chronic high-intensity interval training (HIIT) with caffeine intake (4 and 8 mg /kg). Adaptation occurred between day −10 to 0 (with a gradual increase in workload to 10.5% body weight). On day 2 we measured blood lactate content (LT). On day 3 HIIT was started, three times a week, with a 48 hours interval between each session. Workload (%) can be found in the timeline. The last HIIT session was performed at day 45. The elevated plus maze task was performed 48 hours later.
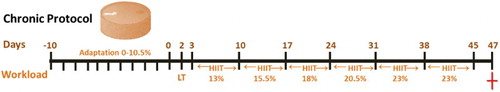
Table 1. High-intensity interval training (HIIT) protocol.
Figure 2. Effects of chronic high-intensity interval training (HIIT) and caffeine (4 and 8 mg/kg) in the elevated plus maze task. (A) Number of closed-arm entries, (B) number of open-arm entries, (C) time spent in the closed arms, (D) time spent in the open arms, (E) time spent in the centre and (F) total number os entries to arms. Data are expressed as mean ± SEM. P < 0.05 represents a significant difference. * Indicates significant difference compared to the vehicle group. # indicates significant difference compared to the HIIT group (ANOVA one-way followed by post hoc Tukey, n = 8–10).
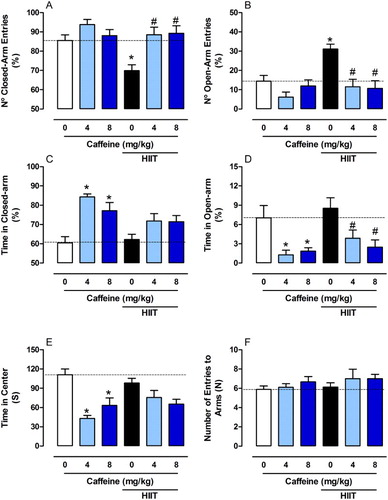
Figure 3. Effects of chronic high-intensity interval training (HIIT) and caffeine (4 and 8 mg/kg) on behaviour in the elevated plus maze task. (A) Head dips and (B) Number of faecal pellets. Data are expressed as mean ± SEM. P < 0.05 represents a significant difference. * Indicates significant difference compared to the vehicle group. # indicates significant difference compared to the HIIT group (ANOVA one-way followed by post hoc Tukey, n = 8–10).
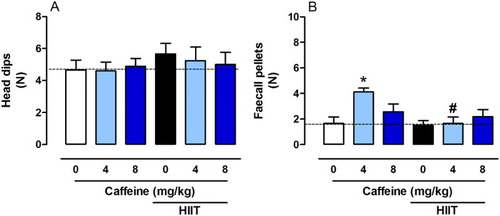
Figure 4. Effects of chronic high-intensity interval training (HIIT) and caffeine (4 and 8 mg/kg) in Na+-K+-ATPase activity in the cortex (A), hippocampus (B) and striatum (C). Data are expressed as mean ± SEM. P < 0.05 represents a significant difference. * Indicates significant difference compared to the vehicle group. # indicates significant difference compared to the HIIT group (ANOVA one-way followed by post hoc Tukey, n = 6–8).
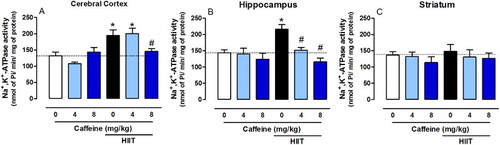
Figure 5. Effects of chronic high-intensity interval training (HIIT) and caffeine (4 and 8 mg/kg) in superoxide dismutase (SOD) and catalase (CAT) activities. SOD activity in the cortex (A), hippocampus (B) and striatum (C). CAT activity in the cortex (D), hippocampus (E) and striatum (F). Data are expressed as mean ± SEM. P < 0.05 represents a significant difference. * Indicates significant difference compared to the vehicle group. # indicates significant difference compared to the HIIT group (ANOVA one-way followed by post hoc Tukey, n = 6–8).
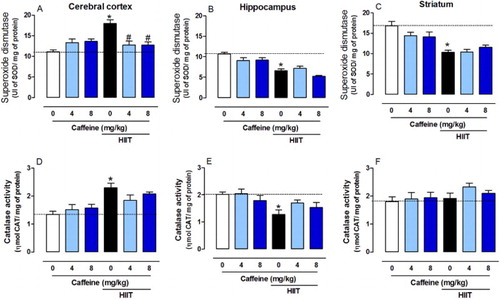
Figure 6. Effects of chronic high-intensity interval training (HIIT) and caffeine (4 and 8 mg/kg) in glutathione peroxidase (GPx) activity and in reduced glutathione levels (GSH). GPx activity in the cortex (A), hippocampus (B) and striatum (C). GSH levels in the cortex (D), hippocampus (E) and striatum (F). Data are expressed as mean ± SEM. P < 0.05 represents a significant difference. * Indicates significant difference compared to the vehicle group. # indicates significant difference compared to the HIIT group (ANOVA one-way followed by post hoc Tukey, n = 6–8).
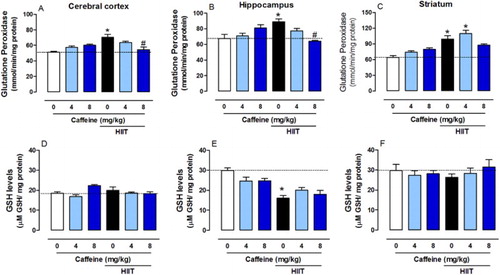
Figure 7. Effects of chronic high-intensity interval training (HIIT) and caffeine (4 and 8 mg/kg) in malondialdehyde (MDA) levels in the cortex (A), hippocampus (B) and striatum (C). Data are expressed as mean ± SEM. P < 0.05 represents a significant difference. * indicates significant difference compared to the vehicle group. # Indicates significant difference compared to the HIIT group (ANOVA one-way followed by post hoc Tukey, n = 6–8).
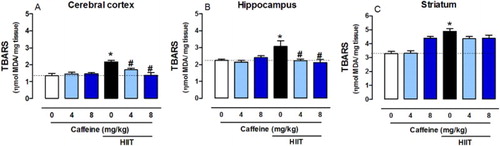
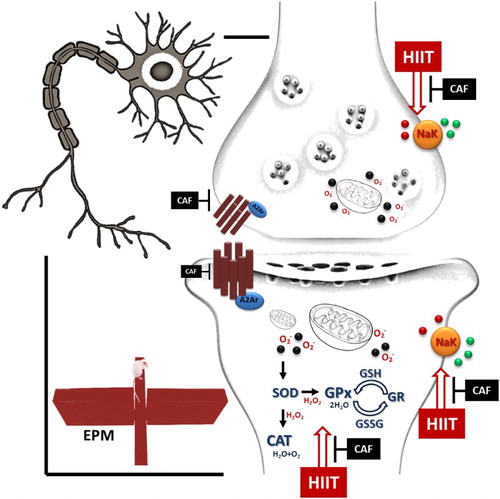
Figure 8. Neurochemical and behavioural changes found in rats submitted to chronic HIIT and caffeine intake.