Figures & data
Figure 1. Diagram showing experimental design with animal grouping.
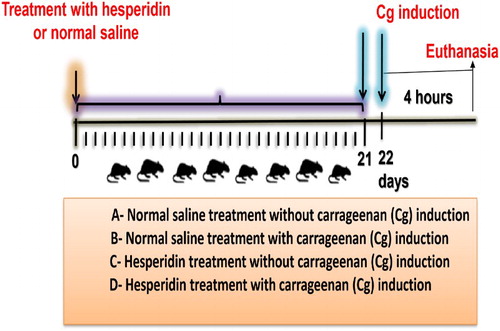
Table 1. Exudate volume and total leukocyte count in carrageenan-induced acute inflammation in rats pretreated with hesperidin.
Figure 2. Effect of hesperidin on myeloperoxidase activity in rat plasma of carrageenan-induced pleurisy. The results were expressed as mean ± SEM (n = 6),*P < 0.05, **P < 0.01 and ***P < 0.001 compared to the PLE or/and CTL group. Key: CTL: rats were administered saline solution only (Normal control group); PLE: rats were administered saline solution (NaCl 0.9%) orally and injected with carrageenan (Inflammation control group); HSD: rats were administered 80 mg/kg of hesperidin only (Hesperidin group); PLE + HSD: rats were administered 80 mg/kg hesperidin orally and intrapleurally injected with carrageenan (Inflammation treated with hesperidin group).
Figure 3. (A) Effect of hesperidin on ROS production in exudates cells of carrageenan-induced pleurisy. The results were expressed as mean ± SEM (n = 6), *P < 0.05, **P < 0.01 and ***P < 0.001 compared to the PLE or/and CTL group. (B) Representative plot of flow cytometric analysis of ROS production in pleural exudates cells using dihydrorhodamine 123 dye. Key: CTL: rats were administered saline solution only (Normal control group); PLE: rats were administered saline solution (NaCl 0.9%) orally and injected with carrageenan (Inflammation control group); HSD: rats were administered 80 mg/kg of hesperidin only (Hesperidin group); PLE + HSD: rats were administered 80 mg/kg hesperidin orally and intrapleurally injected with carrageenan (Inflammation treated with hesperidin group).
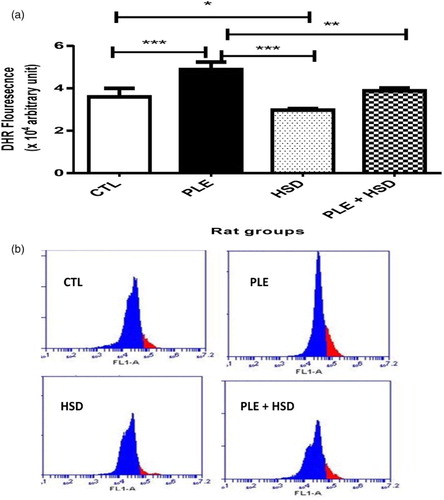
Figure 4. Effect of hesperidin on ROS production in rat liver of carrageenan-induced pleurisy. The results were expressed as mean ± SEM (n = 6), *P < 0.05, **P < 0.01 and ***P < 0.001 compared to the PLE or/and CTL group. Key: CTL: rats were administered saline solution only (Normal control group); PLE: rats were administered saline solution (NaCl 0.9%) orally and injected with carrageenan (Inflammation control group); HSD: rats were administered 80 mg/kg of hesperidin only (Hesperidin group); PLE + HSD: rats were administered 80 mg/kg hesperidin orally and intrapleurally injected with carrageenan (Inflammation treated with hesperidin group).
Figure 5. Effect of hesperidin on TBARS generation in rat liver of carrageenan-induced pleurisy. The results were expressed as mean ± SEM (n = 6), *P < 0.05, **P < 0.01 and ***P < 0.001 compared to the PLE or/and CTL group. Key: CTL: rats were administered saline solution only (Normal control group); PLE: rats were administered saline solution (NaCl 0.9%) orally and injected with carrageenan (Inflammation control group); HSD: rats were administered 80 mg/kg of hesperidin only (Hesperidin group); PLE + HSD: rats were administered 80 mg/kg hesperidin orally and intrapleurally injected with carrageenan (Inflammation treated with hesperidin group).
Figure 6. Effect of hesperidin on δ-ALAD activity in rat liver of carrageenan-induced pleurisy. The results were expressed as mean ± SEM (n = 6), *P < 0.05, **P < 0.01 and ***P < 0.001 compared to the PLE or/and CTL group. CTL: Control; PLE: Inflammation only; HSD: Hesperidin only; PLE + HSD: Inflammation with hesperidin.
Figure 7. Effect of hesperidin on SOD activity in rat liver of carrageenan-induced pleurisy. The results were expressed as mean ± SEM (n = 6), *P < 0.05, **P < 0.01 and ***P < 0.001 compared to the PLE or/and CTL group. Key: CTL: rats were administered saline solution only (Normal control group); PLE: rats were administered saline solution (NaCl 0.9%) orally and injected with carrageenan (Inflammation control group); HSD: rats were administered 80 mg/kg of hesperidin only (Hesperidin group); PLE + HSD: rats were administered 80 mg/kg hesperidin orally and intrapleurally injected with carrageenan (Inflammation treated with hesperidin group).
Figure 8. Effect of hesperidin on CAT activity in rat liver of carrageenan-induced pleurisy. The results were expressed as mean ± SEM (n = 6), *P < 0.05, **P < 0.01 and ***P < 0.001 compared to the PLE or/and CTL group. Key: CTL: rats were administered saline solution only (Normal control group); PLE: rats were administered saline solution (NaCl 0.9%) orally and injected with carrageenan (Inflammation control group); HSD: rats were administered 80 mg/kg of hesperidin only (Hesperidin group); PLE + HSD: rats were administered 80 mg/kg hesperidin orally and intrapleurally injected with carrageenan (Inflammation treated with hesperidin group).
Figure 9. Effect of hesperidin on NPSH level in rat liver of carrageenan-induced pleurisy. The results were expressed as mean ± SEM (n = 6), *P < 0.05, **P < 0.01 and ***P < 0.001 compared to the PLE or/and CTL group. Key: CTL: rats were administered saline solution only (Normal control group); PLE: rats were administered saline solution (NaCl 0.9%) orally and injected with carrageenan (Inflammation control group); HSD: rats were administered 80 mg/kg of hesperidin only (Hesperidin group); PLE + HSD: rats were administered 80 mg/kg hesperidin orally and intrapleurally injected with carrageenan (Inflammation treated with hesperidin group).