Figures & data
Table 1. Demographic, clinical and laboratory parameters of the studied groups.
Figure 1. (A) Activity of δ-ALA-D enzyme in women with GDM and controls. Data were expressed as median (interquartile range) in U/L. (B) Reactivation index of δ-ALA-D enzyme in women with GDM and controls. Data were expressed as median (interquartile range) in %. Statistically significant differences from the controls were determined by Mann–Whitney test (* p < 0.0001).
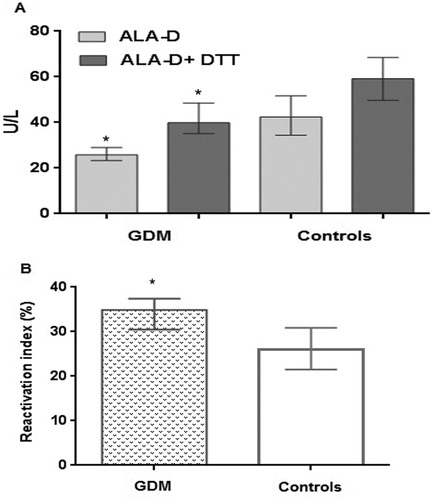
Table 2. Biomarkers of oxidative stress in women with GDM and controls.
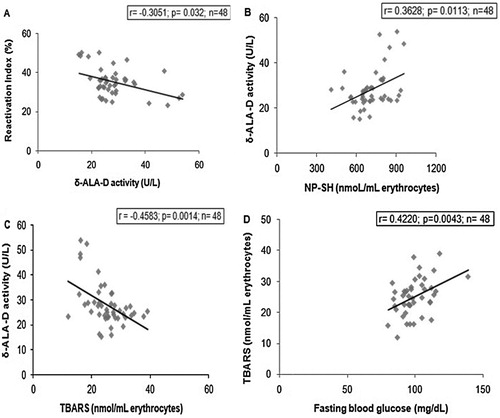
Figure 2. Spearman correlations in women with GDM (n = 48). (A) Correlation between δ-ALA-D activity and the reactivation index (r = −0.3051, p = 0.0032), (B) Correlation between δ-ALA-D activity and NP-SH levels (r = 0.3628, p = 0.0113), (C) Correlation between δ-ALA-D activity and TBARS levels in erythrocytes (r = −0.4583, p = 0.0014), (D) Correlation between TBARS levels in erythrocytes and fasting glucose levels in women with GDM (r = 0.4220, p = 0.0043).