Figures & data
Table 1. General characteristics of the population.
Figure 1. Levels of lipid peroxidation (TBARS) (A) and SOD activity (B) in plasma along the cardiac rehabilitation: M0 (assessment before cardiac rehabilitation; n = 40); M2 (after 2 months: n = 35); M4 (after 4 months: n = 30); M6 (after 6 months: n = 28). The one entry (one-way ANOVA) and Holm–Sidak, after testing the assumptions of normality and sphericity by the D’Agostino and Pearson test was performed for analysis of the four moments, followed by the Dunn’s test and the statistical difference was denoted by *p < 0.05, **p < 0.01 and ***p < 0.001.
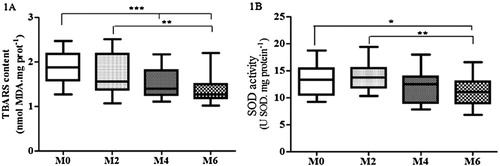
Table 2 . Markers of oxidative stress and activity of antioxidants enzymes measured in four moments during cardiac rehabilitation program: M0 (assessment before cardiac rehabilitation; n = 40); M2 (after 2 months: n = 35); M4 (after 4 months: n = 30); M6 (after 6 months: n = 28).
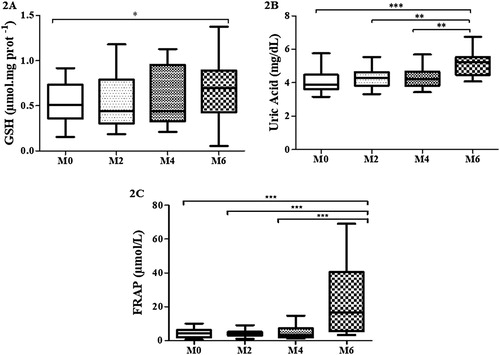
Figure 2. Levels of GSH (A), acid uric (B) and FRAP (C) in whole blood along cardiac rehabilitation: M0 (assessment before cardiac rehabilitation; n = 40); M2 (after 2 months: n = 35); M4 (after 4 months: n = 30); M6 (after 6 months: n = 28).The one entry (one-way ANOVA) and Holm–Sidak, after testing the assumptions of normality and sphericity by the D’Agostino and Pearson test was performed for analysis of the four moments, followed by the Dunn’s test and the corresponding statistical differences. For FRAP data, the Friedman test was performed for analysis of the four moments, followed by the Dunn’s test and the statistical difference was denoted by *p < 0.05, **p < 0.01 and ***p < 0.001.