Figures & data
Figure 1. Study design. T0 = base line; T40 = after a single bout of intense exercise at 85% of the maximal heart rate (HRmax).
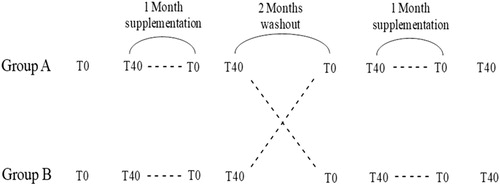
Figure 2. Timecourse of the speedrate of runners. Speed is expressed as percentage of maximal speed recorded before supplementation (gray) and after treatment (black). Placebo (A) or 200 mg of ubiquinol (B) for 1 month.
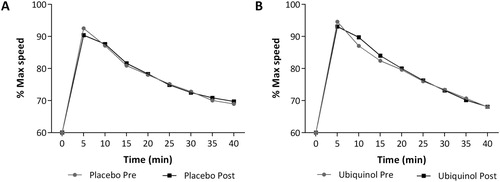
Figure 3. Distribution of average speed (A) and total time of run conducted at values equal and above 75% of the maximal speed (B). For both parameters distribution of data is represented for each of the four experimental phases.
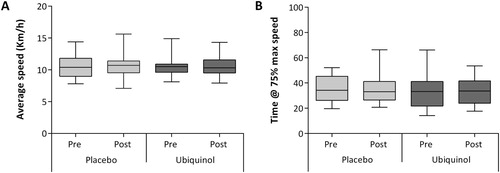
Figure 4. Hematochemical parameters expressed as percentage of variation after a single session of intense exercise.
Notes: Mb: myoglobin; CK: creatine kinase; CREA: creatine; TG: triglycerides; UA: uric acid; GLU: glucose; UREA: urea; LDL: low density lipoproteins; HDL: high-density lipoproteins; ALB: albumin; CoQ plasma content (µg/mL) and lipoprotein content (nmol CoQ/mmol Cholesterol). Data are expressed as box plot of % variation pre-post session. All variations are highly significant (p < .01) except for CoQ plasma content, NS: not significant.
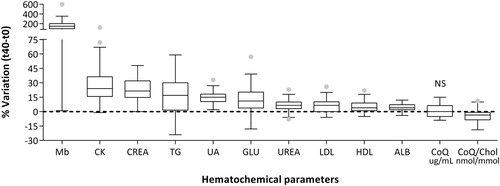
Figure 5. Creatine kinase (CK) and Myoglobin (Mb) level at the end of session of intense exercise (t40–t0) and after placebo or 200 mg of ubiquinol supplementation for 1 month.
Note: Data are expressed as % of CK and Mb variation and they are represented as box plot diagram.
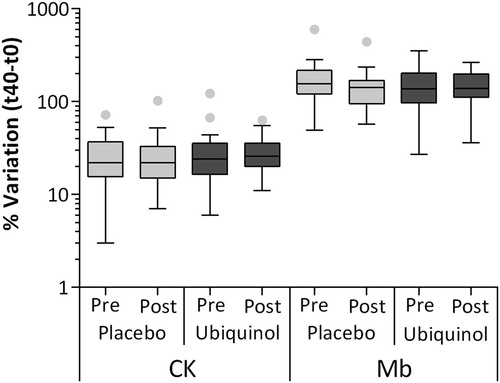
Figure 6. Plasma levels of coenzyme Q10 normalized to cholesterol levels (A) and percentage of oxidized coenzyme Q10 (B) before and after both session of intense exercise and placebo or 200 mg of ubiquinol supplementation for 1 month.
Notes: Data are respectively expressed as CoQ10 nmol/cholesterol mmol and % of CoQ10 oxidized/CoQ10 total and they are represented as box plot diagram. *Significantly different from t0; °Significantly different from pre-supplementation values; *p < .05; **/°°p < .01.
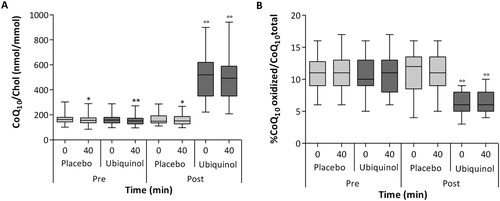
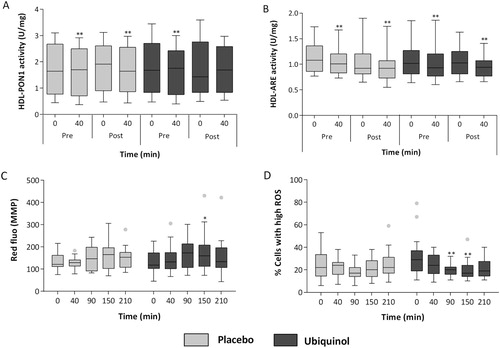
Figure 7. Paraoxonase (PON1) (A) and arylesterase (ARE) activity (B) normalized to high-density lipoprotein (HDL) before and after both sessions of intense exercise and placebo or 200 mg of ubiquinol supplementation for 1 month. Mean fluorescence intensity of MitoSense Red proportional to mitochondrial membrane potential (C) and percentage of cells with high intracellular ROS content (D) after both a single session of intense exercise and during recovery (t90–150–210 min) and after placebo or 200 mg of ubiquinol supplementation for 1 month.
Notes: Data are respectively expressed as Unit/milligrams of high-density lipoprotein and red or green fluorescence of cation probe and they are represented as box plot diagram. *Significantly different from t0; *p < .05; **p < .01.