Figures & data
Figure 1. Effects of hesperetin on acrolein-induced toxicity to LLC cells. (A) The structure of hesperetin. (B) The viability of untreated (control) LLC cells and cells treated with 30 μM hesperetin (HSPT) upon exposure to 30 μM acrolein for 1 h was evaluated using an MTT assay. (C) Immunoblot analysis of apoptosis-related proteins. Cell extracts were electrophoresed on 10–15% SDS-polyacrylamide gels, transferred to nitrocellulose membranes, and immunoblotted with antibodies against cleaved caspase-3 (c-caspase-3), cleaved PARP (c-PARP), cytochrome C, and p-p53. β-Actin was used as an internal control. The protein levels were normalized to the actin levels to analyze the immunoblotting data. Data are presented as the mean ± SD of four independent experiments. *p < .05 versus cells exposed to acrolein. Acro, acrolein.
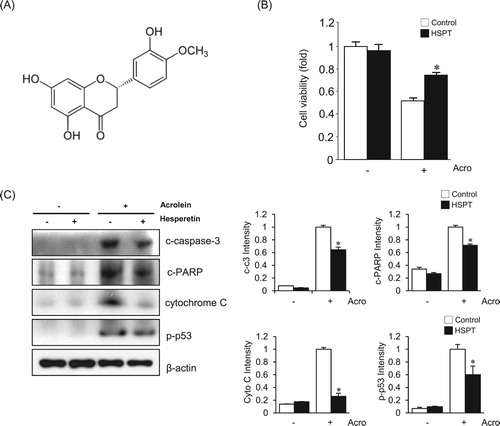
Figure 2. Effects of hesperetin on the cellular redox status and oxidative damage to LLC cells exposed to acrolein. (a) LLC cells were stained with DCFH-DA for 30 min, and DCF fluorescence was measured by fluorescence microscopy. (B) Mitochondrial membrane potential of LLC cells was measured by incorporation of the rhodamine 123 dye into mitochondria. (C) Immunoblot analysis of Prx-SO3 levels in LLC cell lysates. β-Actin was used as an internal control. The protein levels were normalized to the actin levels to analyze the immunoblotting data. Data are presented as the mean ± SD of four independent experiments. *p < .05 versus cells exposed to acrolein. (D) Fluorescence images of CMAC-loaded cells were acquired under a microscope to evaluate cellular GSH levels. HSPT, hesperetin.
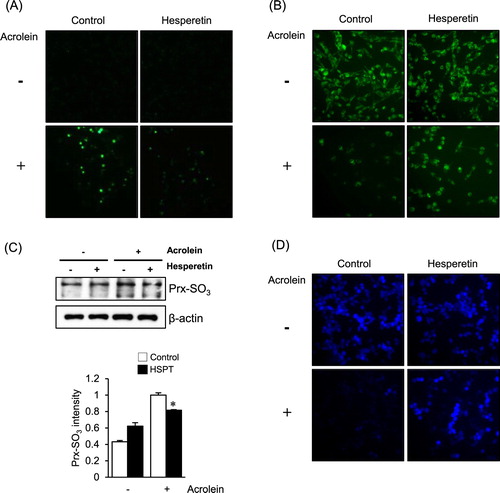
Figure 3. Effects of hesperetin on acrolein-induced lung damage in mice. Mice were exposed to filtered air or acrolein (10 ppm) for 12 h. Hesperetin (HSPT; 60 mg/kg) or PBS (control) was intraperitoneally administered to mice 1 h prior to acrolein exposure. (A) H&E-stained sections of lung tissues after acrolein exposure. (B) Mason trichrome staining and elastic staining of sections of lung tissues after acrolein exposure. (C) The Murray lung injury (MLI) score and fibrosis score were calculated based on the results of (A,B). Data are presented as the mean ± SD (n = 3–6 mice per group). *p < .05 versus acrolein-treated mice. (D) Immunofluorescence and immunoblot data comparing the levels of apoptotic marker proteins in lung tissue extracts from acrolein-treated mice. β-Actin was used as an internal control. (E) Immunofluorescence and immunoblot data comparing the levels of p-p38, p-p53, and p-JNK in lung tissue extracts from acrolein-treated mice. β-Actin was used as an internal control. In (D) and (E), the protein levels were normalized to the β-actin levels to analyze the immunoblotting data. Data are presented as the mean ± SD (n = 3–6 mice per group). *p < .05 versus acrolein-treated mice. Acro, acrolein.
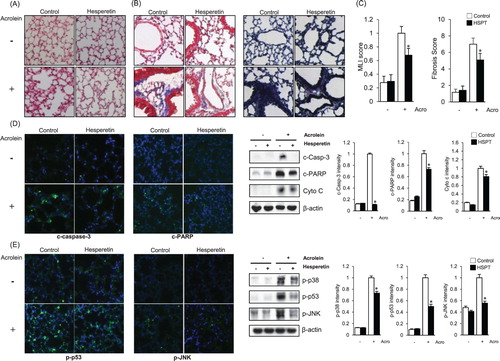
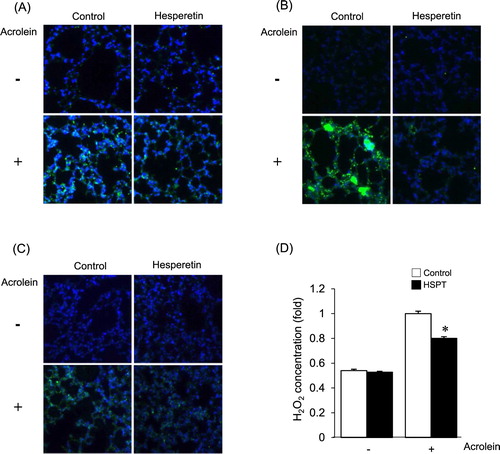
Figure 4. Effects of hesperetin on the modulation of the redox status by acrolein in mice. Hesperetin (HSPT) or PBS (control) was administered to mice prior to acrolein exposure. Immunofluorescence analysis of the levels of Prx-SO3 (A), HNE protein adducts (B), and 8-OH-dG (C) in lung tissues of mice. (D) Intracellular hydrogen peroxide in lung tissue extracts was measured using xylenol orange. The level of hydrogen peroxide of lung tissue from acrolein-exposed control mice was expressed as 1. Data are presented as the mean ± SD (n = 3–6 mice per group). *p < .05 versus acrolein-treated mice.