Figures & data
Figure 1. Bar graphs summarizing (a) body weights, (b) brain to liver weight ratio, (c) kidney weights, and (d) kidney to body weight ratio of AGA and SGA newborn pigs (n = 5 each). *P < 0.05 vs. AGA.
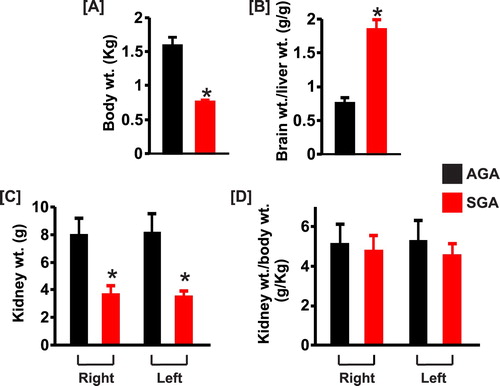
Figure 2. (a) Kidney section images (PAS staining) and (b) bar graphs showing the mean glomerular cross-sectional area in AGA and SGA newborn pigs (n = 5 each). *P < 0.05 vs. AGA; scale bar = 50 µm.
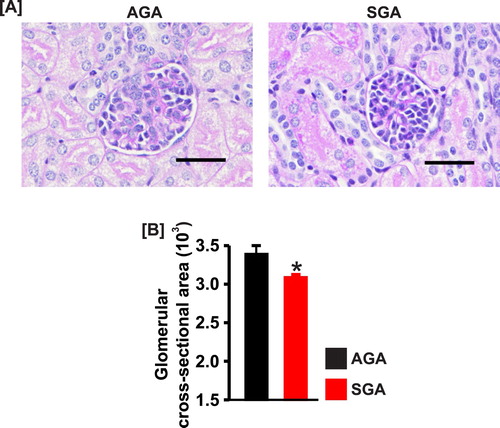
Figure 3. Bar graphs summarizing (a) the levels of malondialdehyde (MDA; n = 5 each), (b) kidney total antioxidant capacity (n = 5 each), and (c) urine total antioxidant capacity (n = 4 each) in SGA compared with AGA newborn pigs. (d) Confocal microscopy images showing immunostaining of nitrotyrosine in AGA and SGA newborn pig kidney sections. (e) bar graphs of mean fluorescence density in AGA and SGA newborn pig kidney sections immunostained for nitrotyrosine (NT); *P < 0.05 vs. AGA. Scale bar = 50 µm.
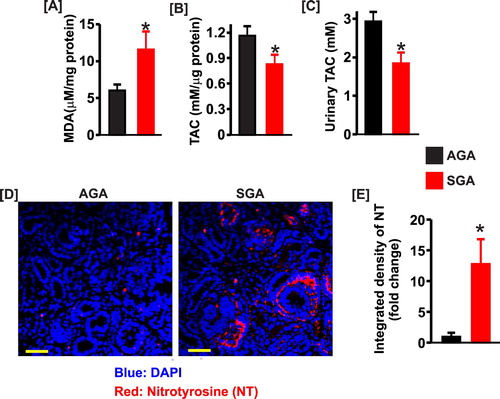
Figure 4. (a) and (b) Western blot images and (c) and (d) bar graphs demonstrating protein expression levels of NOX2 and NOX4 in the kidneys of AGA (n = 4) and SGA (n = 5) newborn pigs. Data were normalized to AGA; *P < 0.05 vs. AGA.
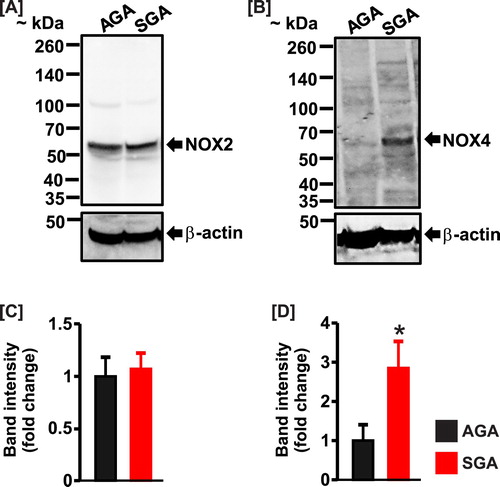
Figure 5. Bar graphs summarizing serum concentrations of (a) sodium, (b) potassium in AGA and SGA newborn pigs (n = 5 each); *P < 0.05 vs. AGA.
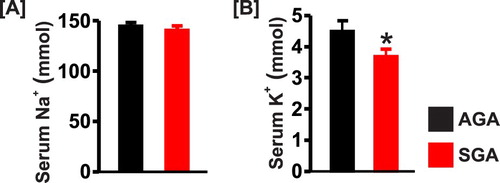
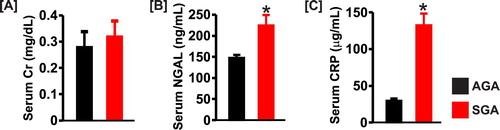
Figure 6. Bar graphs summarizing serum levels of (a) creatinine (Cr), (b) NGAL, and (c) C-reactive protein (CRP) in AGA and SGA newborn pigs (n = 5 each); *P < 0.05 vs. AGA.