Figures & data
Figure 1. Reactive oxygen species production is attenuated in hepatocytes expressing HCV Core or NS3/4A proteins and under external oxidative stress induction. Total reactive oxygen species (a) and mitochondrial superoxide anion production (b) were detected using a set of fluorogenic probes (Cell ROX® Deep Red Reagent and MitoSOX™ Red Reagent, respectively) in Huh-7 cells transiently transfected with the empty vector, pTracerCore or pTracerNS3/4A. Cells were treated with menadione (50 μM) 24 hours post-transfection for 6 hours. As a control and to inhibit the effect of menadione, cells were pre-treated 30 minutes prior to menadione treatment with the anti-oxidant NAC (5 mM). 2-way ANOVA was performed for group comparisons of the means with a Bonferroni post-test and in specific cases a t test was applied to compare the means between single comparisons; the asterisks represent the p value as: ***<0.001, **<0.003 and, *<0.05. (p value > 0.05). NT = No treated cells. n.s. = not significant. Experiments were conducted in duplicate wells and results are expressed as the average of three independent experiments.
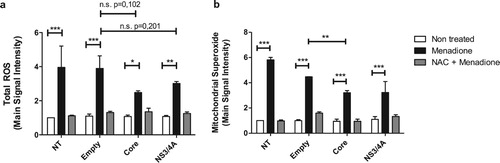
Figure 2. Antioxidant enzymes are not regulated by expression of viral proteins or exposure to oxidative stress in Huh-7 cells. The mRNA expression levels of the antioxidant SOD enzymes SOD1 and SOD2 (a), scavenging enzymes of H2O2, CAT and GPx1 (b), and HO-1 (c) were determined using qPCR in Huh-7 cells transiently expressing the empty vector, pTracerCore or pTracerNS3/4A with or without menadione treatment for 6 hours. The relative mRNA expression was normalized to the expression of 18S. 2-way ANOVA was performed for a group comparison of the means with a Bonferroni post-test and t test was applied to compare the means between single comparisons; the asterisks represent the p value as: ***<0.001, **<0.003 and, *<0.04. (p value > 0.05). NT = No treated cells.
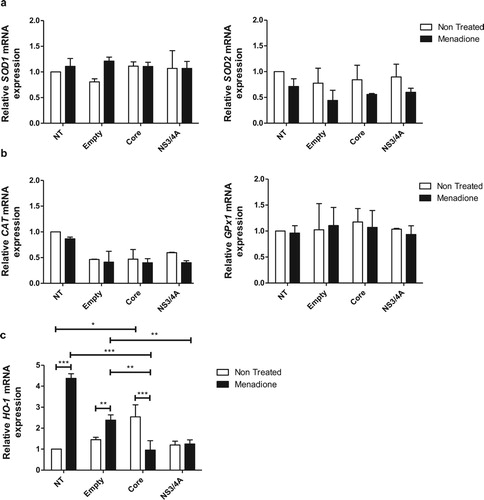
Figure 3. Core induces gene expression of heme-oxygenase-1 in rat primary hepatocytes. Hepatocytes were transfected with the empty vector, pTracerCore and pTracerNS3/4A separately. 24 hpt cells were harvested and sorted according to the expression of GFP. Transfected [GFP(+)] and not transfected [GFP(−)] cells were obtained. (a) The mRNA expression of HO-1 was significantly increased in primary hepatocytes expressing HCV Core but not NS3/4A. The mRNA expression of antioxidant enzymes (b) SOD1 and (c) SOD2 was not changed in hepatocytes expressing HCV Core or NS3/4A. mRNA levels were quantified by qPCR. Relative expression was normalized to 18S. t test was performed to compare the means and the asterisks represent p value *<0.03. (p value > 0.05). NT = No treated cells.
![Figure 3. Core induces gene expression of heme-oxygenase-1 in rat primary hepatocytes. Hepatocytes were transfected with the empty vector, pTracerCore and pTracerNS3/4A separately. 24 hpt cells were harvested and sorted according to the expression of GFP. Transfected [GFP(+)] and not transfected [GFP(−)] cells were obtained. (a) The mRNA expression of HO-1 was significantly increased in primary hepatocytes expressing HCV Core but not NS3/4A. The mRNA expression of antioxidant enzymes (b) SOD1 and (c) SOD2 was not changed in hepatocytes expressing HCV Core or NS3/4A. mRNA levels were quantified by qPCR. Relative expression was normalized to 18S. t test was performed to compare the means and the asterisks represent p value *<0.03. (p value > 0.05). NT = No treated cells.](/cms/asset/98b06a15-093c-4362-8457-6ddfa85734e4/yrer_a_1596431_f0003_ob.jpg)
Figure 4. Hepatocytes expressing Core and NS3/4A are resistant to apoptotic cell death induced by oxidative stress. (a) Huh-7 cells were transfected with empty vector, pTracerCore and, pTracerNS3/4A. 24 hpt apoptotic cells were detected using DilC1(5) and propidium iodide (PI) and evaluated by flow cytometry according to manufacturer`s instructions. Expression of HCV Core and NS3/4A alone induces minor apoptosis. (b) Caspase 3 activity was determined in transfected Huh-7 cells treated with menadione (50 μM). Caspase 3 activity was significantly reduced in menadione-treated cells expressing HCV Core and NS3/4A compared to cells transfected with the empty vector. Treatment with the antioxidant NAC (5 mM) restored and even aggravated the apoptotic profile of HCV Core and NS3/4A. 2-way ANOVA was performed for group comparisons of the means with a Bonferroni post-test and in specific cases a t test was applied to compare the means between single comparisons; the asterisks represent p values: ***<0.001 and *<0.05. (p value > 0.05). NT = No treated cells.
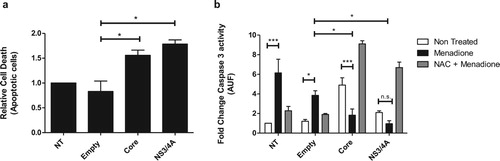
Figure 5. ER stress is reduced in hepatocytes expressing HCV NS3/4A proteins after external oxidative stress induction. ER stress was assessed by determining mRNA expression of the ER stress markers GRP78 (HSPA5) (a) and sXBP1 (b). Tunicamycin was used as a positive control to induce ER stress. Transfection with NS3/4A, but not with empty vector or Core, induced ER stress comparable to the ER stress induced by tunicamycin (5 μg/ml). In our model (menadione treatment), NS3/4A-induced ER stress was significantly reduced (a and b). t test was performed to compare the means of mRNA expression and the asterisks represent the p value: ** < 0.01 and *<0.05. (p value > 0.05). NT = No treated cells. DMSO = Dimethyl sulfoxide.
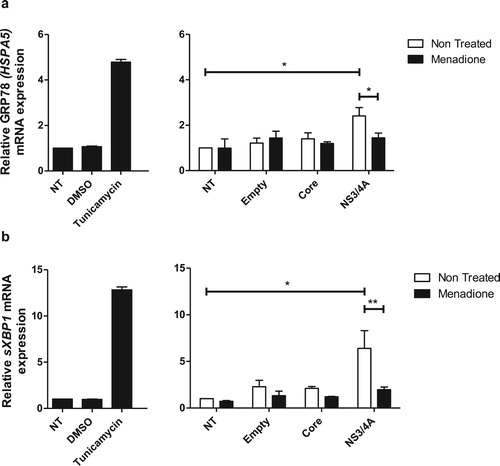
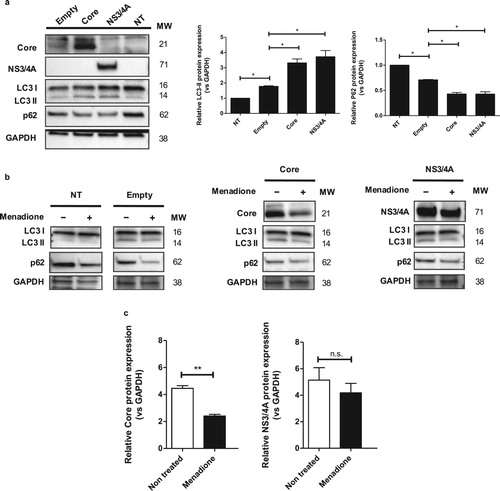
Figure 6. p62 may be involved in the reduction of oxidative stress via degradation of HCV Core protein. (a) Huh-7 cells were transfected with the empty vector, pTracerCore and pTracerNS3/4A. 24 hpt the expression of LC3-I/II, p62, Core, NS3/4A and GAPDH (loading control) were determined by Western blot. Protein expression of LC3-II was increased, whereas expression of p62 was significantly decreased in cells expressing HCV Core and NS3/4A indicating autophagy. (b) Treatment with menadione also decreased expression of p62, whereas protein levels of LC3-II remained stable. Cells expressing HCV Core and NS3/4A also displayed clearly reduced levels of p62 whereas levels of LC3-II remained stable. (c) After menadione treatment, the protein level of HCV Core and NS3/4A was quantified. HCV Core was significantly reduced while the protein level of NS3/4A remained stable. t test was performed to compare the means from the densitometry analysis and the asterisks represent p values: **<0.06 and *<0.02. (p value > 0.05). NT = No treated cells. MW = Molecular weight.