Figures & data
Figure 1. (A) Chemical structure of Vitamin D3 [25- Hydroxyvitamin D3 or (C27H44O2)], (B) struture of Streptozotocin [N-(methylnitrosocarbamoyl)-α-d-glucosamine or (C8H15N3O7)], (C) schematic representation in days of the experimental design. Day 0 indicates the day of surgery (icv- STZ infusion).
![Figure 1. (A) Chemical structure of Vitamin D3 [25- Hydroxyvitamin D3 or (C27H44O2)], (B) struture of Streptozotocin [N-(methylnitrosocarbamoyl)-α-d-glucosamine or (C8H15N3O7)], (C) schematic representation in days of the experimental design. Day 0 indicates the day of surgery (icv- STZ infusion).](/cms/asset/febe4ede-4f31-4d89-9300-d2f85b0186ff/yrer_a_1617514_f0001_oc.jpg)
Figure 2. AChE activity in the cerebral cortex of rats with Sporadic Dementia of Alzheimer Type (SDAT) and treated with Vitamin D3 (VD) in different doses (12.5, 42 and 125 µg/kg). * indicates significant difference from the control (CTL) (p < 0.05). # indicates significant difference from the SDAT group (p < 0.05). Each column represents mean ± SEM (n = 7). Results are expressed as µmol AcSCh/mg protein (one-way ANOVA followed by Kruskal–Wallis).
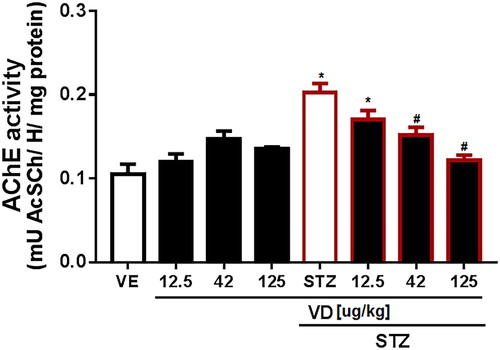
Figure 3. AChE activity in synaptosomes of the cerebral cortex of rats with Sporadic Dementia of Alzheimer Type (SDAT) and treated with Vitamin D3 (VD) in doses of 125 µg/kg. * indicates significant difference from the control (CTL) (p < 0.05). # indicates significant difference from SDAT group (p < 0.05). Each column represents mean ± SEM (n = 7). Results are expressed as µmol AcSCh/mg protein (one- way ANOVA followed by Kruskal–Wallis).
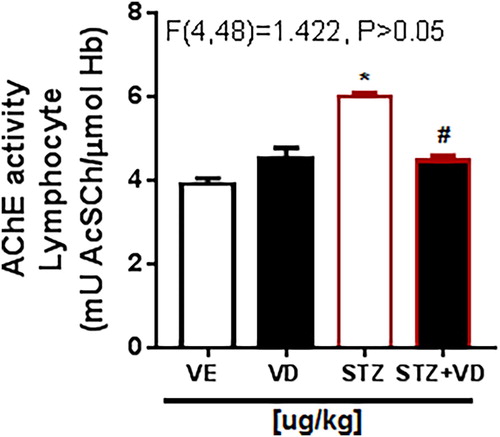
Figure 4. (A) ROS levels in cerebral cortex of rats with Sporadic Dementia of Alzheimer Type (SDAT) and treated with Vitamin D3 (VD) in different doses (12.5, 42 and 125 µg/kg). Results are expressed as ρmol DFC/mg protein (one- way ANOVA followed by Kruskal–Wallis). (B) TBARS levels in the cerebral cortex of rats with Sporadic Dementia of Alzheimer Type (SDAT) and treated with Vitamin D3 (VD) in different doses (12.5, 42 and 125 µg/kg). * indicates significant difference from the control (CTL) (p < 0.05). # indicates significant difference from the SDAT group (p < 0.05). Each column represents mean ± SEM (n = 7). Results are expressed as nmol MDA/mL (one-way ANOVA followed by Kruskal–Wallis). (C) Carbonyl protein content in the cerebral cortex of rats with Sporadic Dementia of Alzheimer Type (SDAT) and treated with Vitamin D3 (VD) in different doses (12.5, 42 and 125 µg/kg µg/kg). * indicates significant difference from the control (CTL) (p < 0.05). # indicates significant difference from the SDAT group (p < 0.05). Each column represents mean ± SEM (n = 7). Results are expressed as nmol/mg protein (one-way ANOVA followed by Kruskal–Wallis). (D) Vitamin C levels in the cerebral cortex of rats with Sporadic Dementia of Alzheimer Type (SDAT) and treated with Vitamin D3 (VD) in different doses (12.5, 42 and 125 µg/kg µg/kg). * indicates significant difference from the control (CTL) (p < 0.05). Results are expressed as µg/ vit c/g of tissue (one-way ANOVA followed by Kruskal–Wallis).
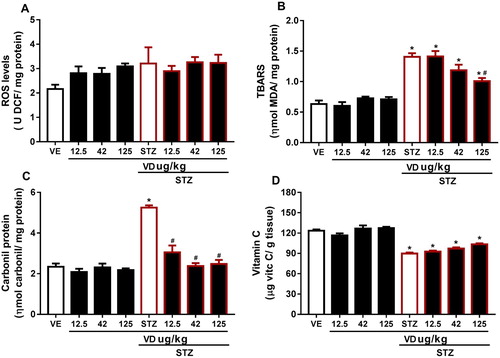
Figure 5. (A) Total SH content in cerebral cortex of rats with Sporadic Dementia of Alzheimer Type (SDAT) and treated with Vitamin D3 (VD) in different doses (12.5, 42 and 125 µg/kg µg/kg). * indicates significant difference from the control (CTL) (p < 0.05). # indicates significant difference from SDAT group (p < 0.05). Each column represents mean ± SEM (n = 7). Results are expressed as nmol of SH/g of tissue (one-way ANOVA followed by Kruskal–Wallis). (B) GSH levels in the cerebral cortex of rats with Sporadic Dementia of Alzheimer Type (SDAT) and treated with Vitamin D3 (VD) in different doses (12.5, 42 and 125 µg/kg µg/kg). * indicates significant difference from the control (CTL) (p < 0.05). # indicates significant difference from the SDAT group (p < 0.05). Each column represents mean ± SEM (n = 7). Results are expressed as µmol/mL (one-way ANOVA followed by Kruskal–Wallis). (C) GSSG levels in the cerebral cortex of rats with Sporadic Dementia of Alzheimer Type (SDAT) and treated with Vitamin D3 (VD) in different doses (12.5, 42 and 125 µg/kg µg/kg). * indicates significant difference from the control (CTL) (p < 0.05). # indicates significant difference from the SDAT group (p < 0.05). Each column represents mean ± SEM (n = 7). Results are expressed as µmol/mL (one-way ANOVA followed by Kruskal–Wallis).
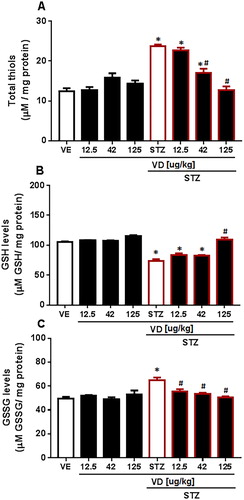
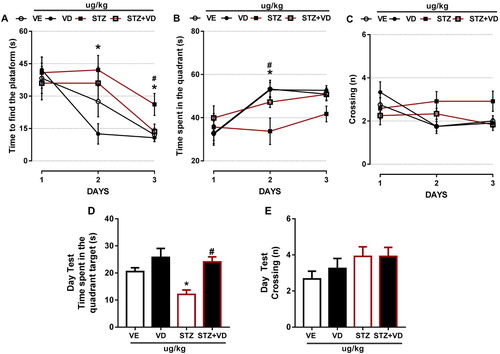
Figure 6. The Morris Water Maze of rats with Sporadic Dementia of Alzheimer Type (SDAT) and treated with Vitamin D3 (VD) in doses of 125 µg/kg. * indicates significant difference from the control (CTL) (p < 0.05). # indicates significant difference from the SDAT group (p < 0.05). Each column represents mean ± SEM (n = 7). Results are expressed as the time to find the platform (A), time to spent in the quadrant (B), crossings (n) (C). The Open-field tests are expressed by time spent in quadrant (s) (D) and crossings (n) (E) (One-way ANOVA followed by Kruskal–Wallis).