Figures & data
Figure 1. Structure of theaflavin.
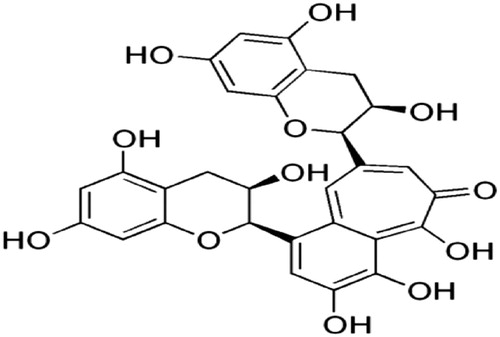
Table 1. Dose dependent effect of theaflavin on blood glucose, insulin levels and HOMA-IR index in control and experimental animals.
Figure 2. Effect of theaflavin on oral glucose tolerance test. Each value is mean ± S.D. for 6 rats (n = 6) in each group.
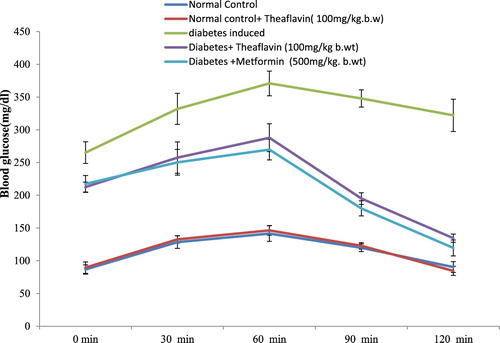
Table 2. Effect of theaflavin on body weight, fluid intake and food intake of control and experimental animals.
Table 3. Effects of theaflavin on hemoglobin and glycosylated hemoglobin levels in control and experimental animals.
Table 4. Effects of theaflavin on glycogen metabolism in control and experimental animals.
Table 5. Effects of theaflavin on carbohydrate metabolic enzymes in control and experimental.
Table 6. Effect of Theaflavin on the levels of TBARS and HP in the tissues of control and experimental rats.
Table 7. Effect of theaflavin on the activities SOD, CAT, GPX and GST in control and experimental rats.
Table 8. Effect of theaflavin on the levels of non-enzymatic antioxidants in tissues of control and experimental rats.
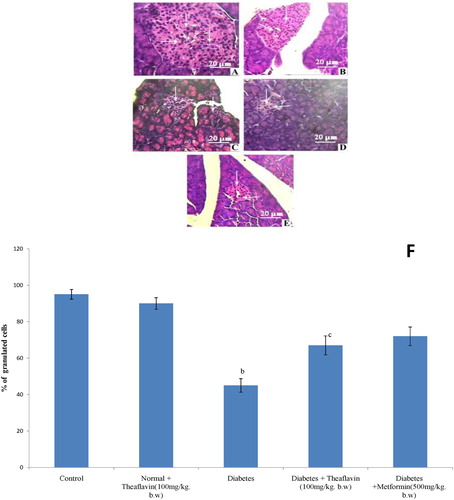
Figure 3. Histopathological section of pancreas of control and Experimental rats (40X). Control (A), Normal + Theaflavin (B), Diabetes induced (C) Diabetic + Theaflavin (D) Diabetic + Metformin (E). (F) Quantification of granulated cells from pancreas. Values are given as mean ± SD for six animals in each group (n = 6). Values are considered significantly different at P < 0.05 with post hoc LSD test. Comparisons are made as (a) Control vs Drug control (Theaflavin alone treated rat); (b) Control rat vs Diabetic rat; (c) Diabetic rat vs Theaflavin treated diabetic rat; (d) Theaflavin treated diabetic rat vs Metformin.