Figures & data
Scheme 1. Interconversion between CoQ10H2 and CoQ10.
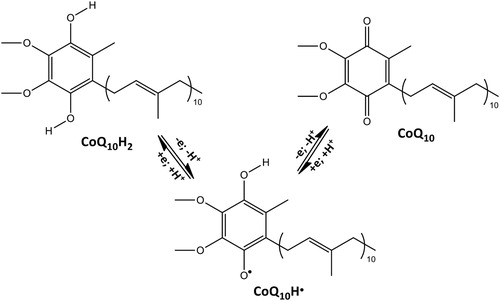
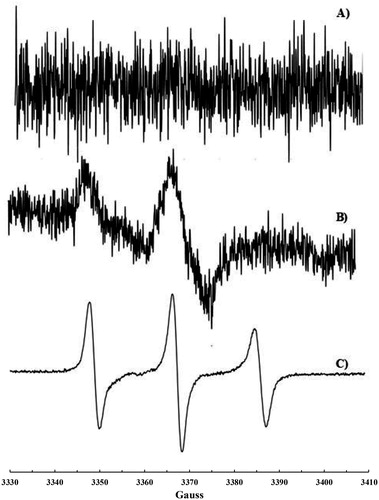
Figure 1. EPR signals recorded on liposomes suspension containing CoQ10: (a) untreated; (b) treated with •NO2 or •NO/•NO2; (c) treated with •NO2 or •NO/•NO2 and extracted with CHCl3.
Scheme 2. Sequence of reactions responsible for nitroxide 6 formation.
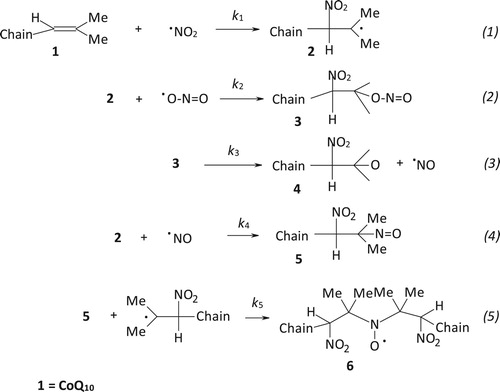
Figure 2. EPR signals recorded on mitochondria suspension: (a) untreated; (b) treated with •NO2 or •NO/•NO2; (c) treated with •NO2 or •NO/•NO2, lysed with Triton X-100 and extracted with CHCl3.
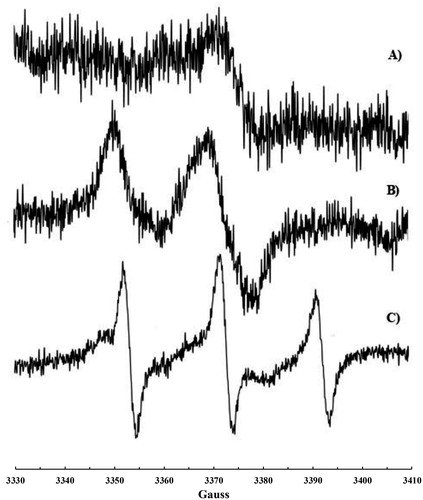
Figure 3. EPR signal recorded on human plasma treated with •NO/•NO2 after addition of CHCl3: (a) plasma sample and (b) plasma sample collected after CoQ10 administration.
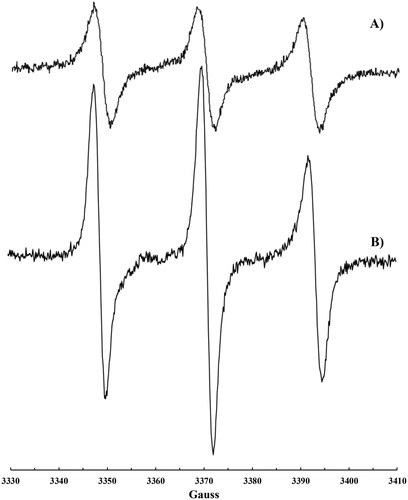
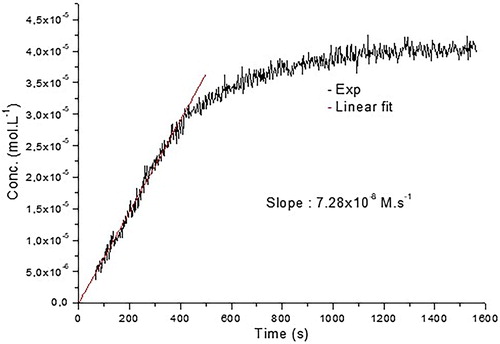
Figure 4. Kinetic of the reaction CoQ10 + •NO2. Linear fit was done for the 400 first seconds leading to a k = 7.28 × 10⁻⁸ M s−1.